

You add gold hoping it will make difficult weeks easier to hold. Then gold has a bad day, and the gold-heavy portfolio ends up behind the classic stock-and-bond mix. Is diversification failing, or asking for a different kind of patience? On Friday, Reuters reported that gold had reversed lower; by the same close, the gold-heavy model had fallen more than the classic mix (Reuters via Kitco).
This issue asks whether diversification failed when the portfolio built for protection fell behind. The same Friday asked for two different kinds of patience from a gold-heavy portfolio and a classic stock-and-bond mix. To answer, we will first name the two fixed models, then separate Friday’s close from the full week and the longer record.
To test that question consistently, Portfolio Lab tracks two fixed hypothetical models rather than anyone’s live account. The gold-heavy line is called Stock-Gold 60/40; the stock-and-bond line is Classic 60/40. The timing and direction line up, but daily data cannot tell us how much gold contributed to the first model’s move or declare either construction the winner. One close cannot establish superiority, and the later path was not knowable when that pressure appeared.
Here is the fuller information screen, after the question is clear. Chair Kevin Warsh said underlying inflation had not meaningfully improved (Federal Reserve). Reuters later reported that gold reversed lower as September rate-hike odds and the dollar rose. Confidence in inflation control could favor risk assets, while higher expected policy rates and a stronger dollar could pressure long Treasuries and gold. The report was directionally consistent with pressure on the gold sleeve, but daily data cannot isolate its contribution to either portfolio.
The fixed public roster is unchanged: 100% QQQ; 100% S&P 500; Stock-Gold 60/40; Classic 60/40; Harry Browne’s Permanent Portfolio. For today’s comparison, the important difference is the defensive sleeve: the former carries more gold, while the latter carries more long Treasuries. That construction difference is observable even though the session move cannot be assigned to one event.
Scoreboard
The scoreboard compares the five fixed public models on the same registered receipt. Alongside return windows and maximum drawdowns, it shows the since-inception Calmar ratio: annualized return divided by maximum drawdown. Within this metric, a higher value means more annualized return per unit of maximum drawdown. Every value comes from the accepted tracker output, not from chart inspection.
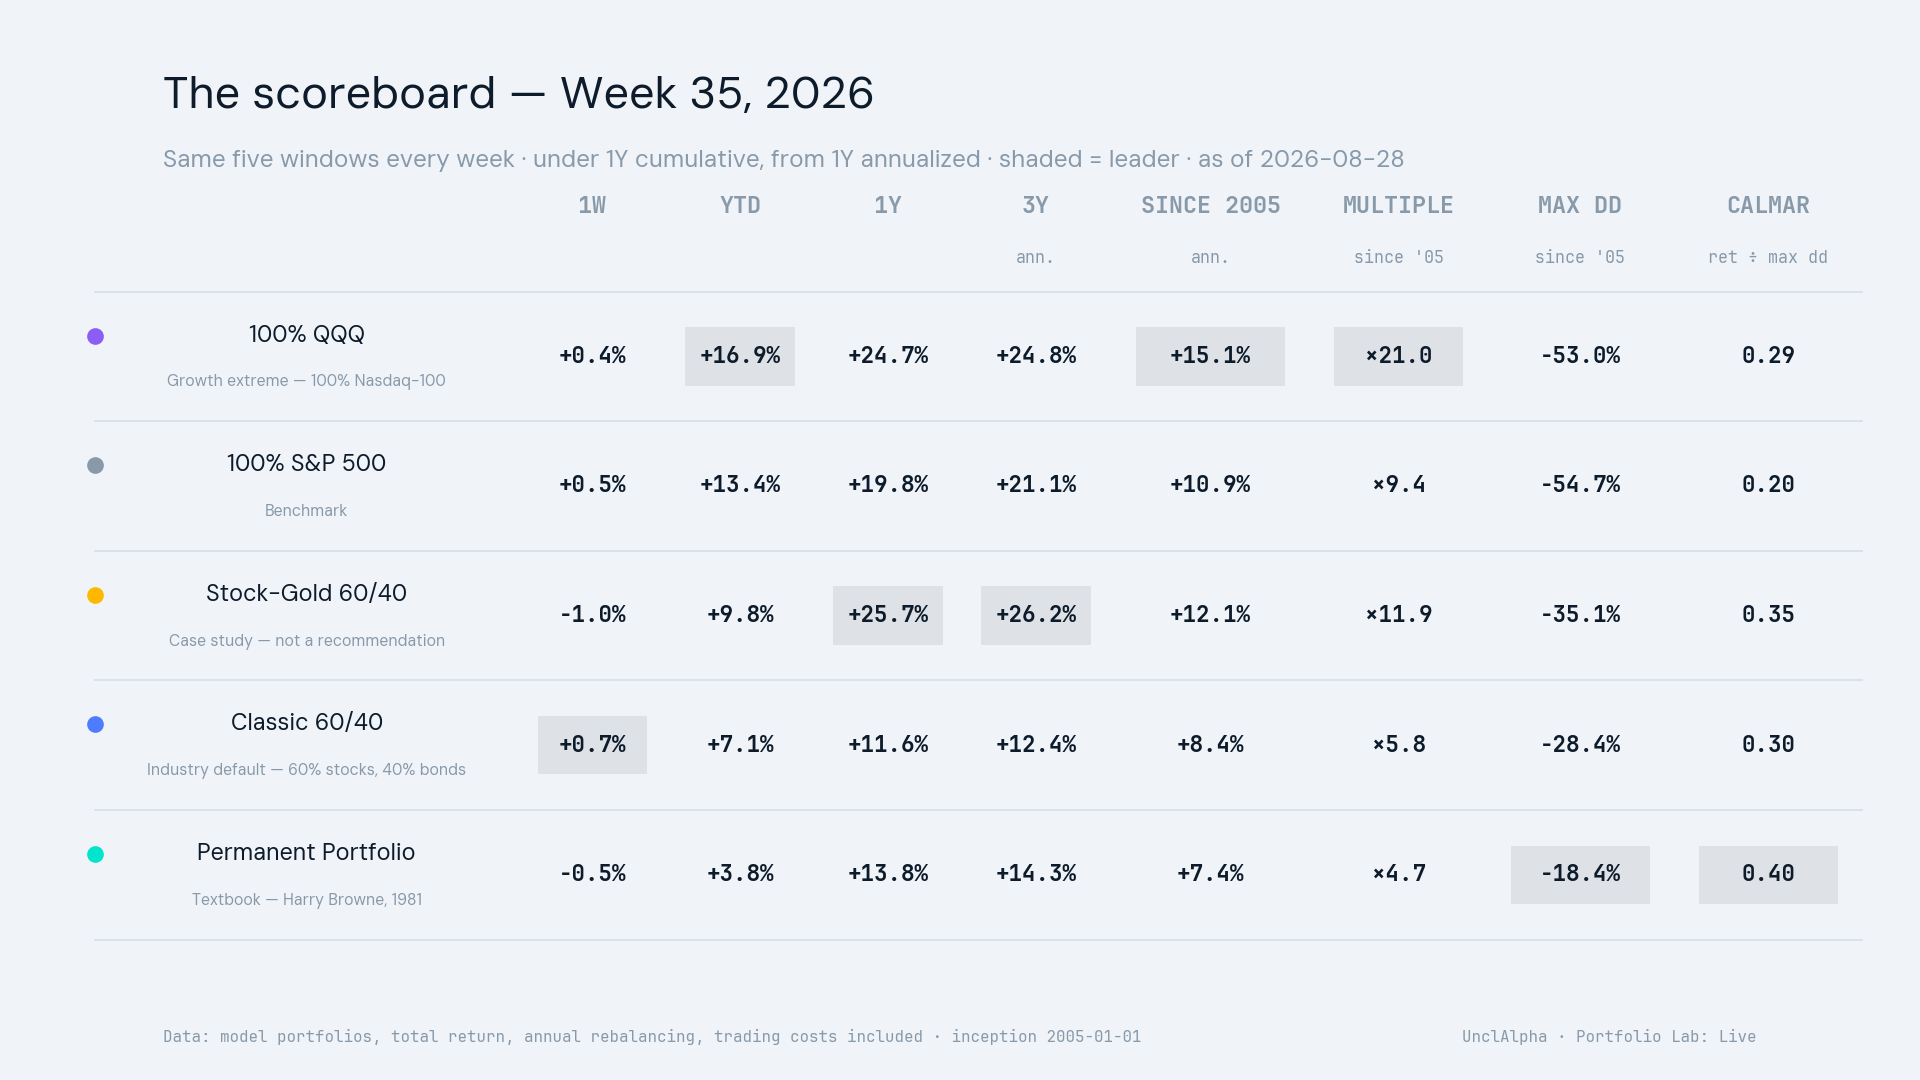
Now the clocks line up. For the full week ending 2026-08-28, Stock-Gold 60/40 returned -1.03%, while Classic 60/40 returned +0.67%. Their since-inception Calmar ratios were 0.3454 and 0.2963, respectively. Friday explains the immediate discomfort; the weekly and longer records answer different questions.
Longer Record
The trailing-one-year view asks a different question from the weekly scene: what did each fixed construction deliver over one common recent window, using the same adjusted-close, distribution-reinvested method.
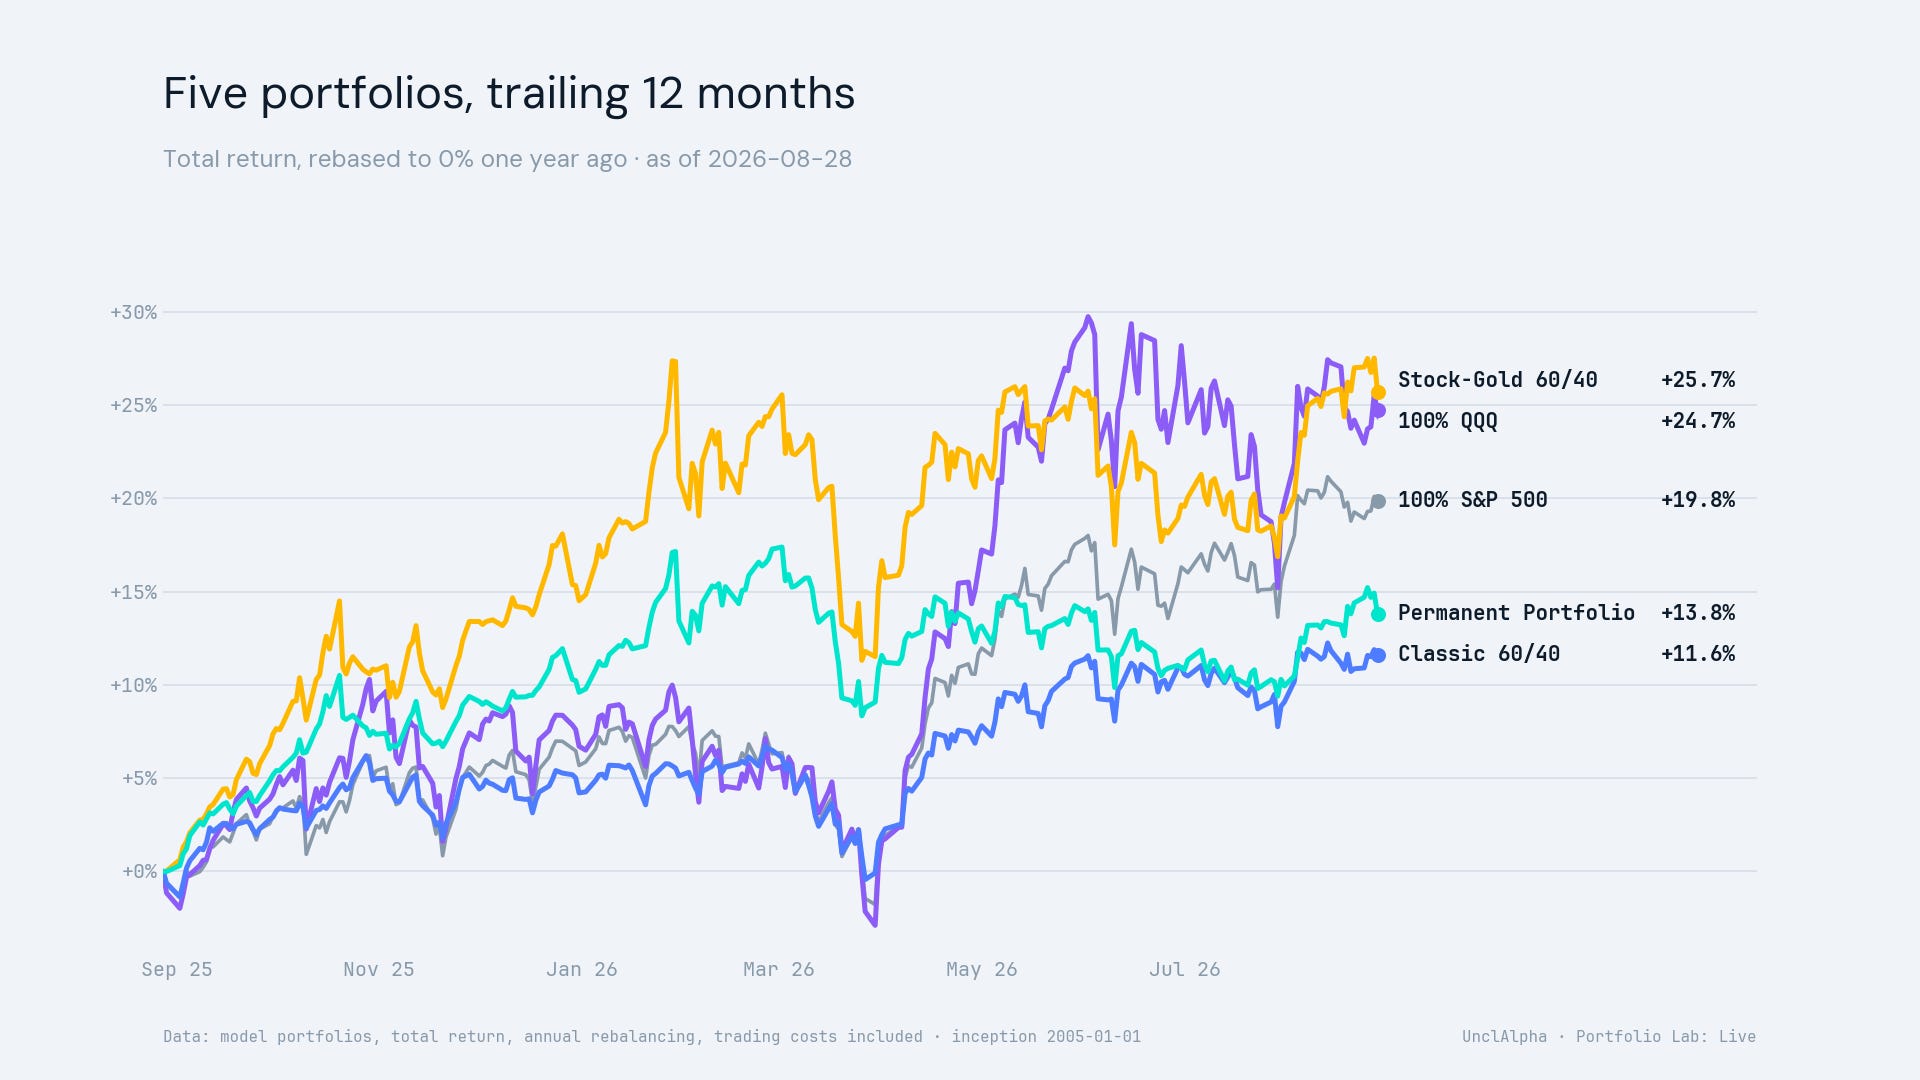
Over the accepted trailing year, Stock-Gold 60/40 returned +25.71%, while Classic 60/40 returned +11.61%. The one-year gap gives the weekly loss pressure context, but it does not turn the latest close into a verdict.
Weekly Path
The weekly path view starts from the 2026-08-21 baseline and follows each recorded session through 2026-08-28, so the reader can see how a still-positive balanced line and a negative gold-heavy line reached different Friday screens.
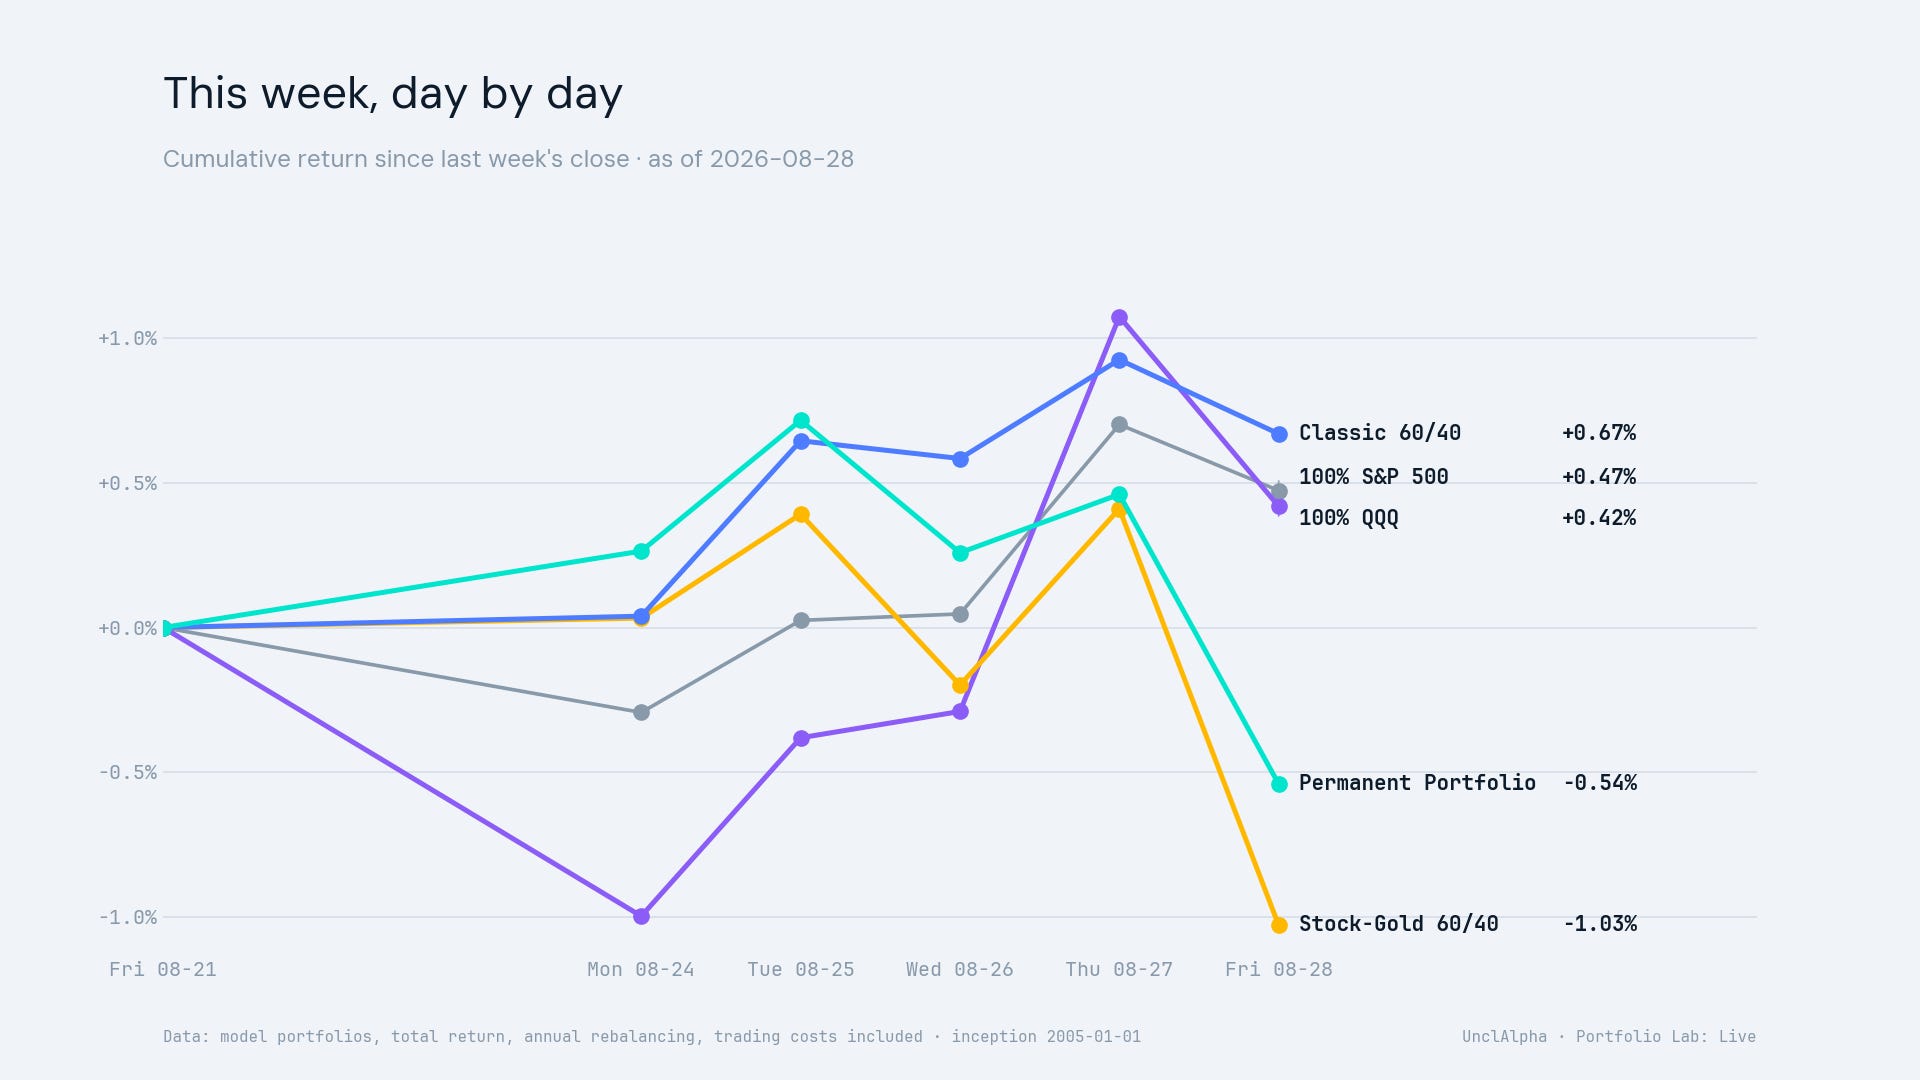
By the Friday close, Stock-Gold 60/40 was down 1.03% for the week, while Classic 60/40 was up 0.67%. The cross-portfolio week-to-date spread on the selected session was 1.70%, which is the path split behind the holder question.
The daily table checks the same decision clock more tightly: it asks whether the Friday move was a broad down day and how much the two selected constructions differed on that single close.
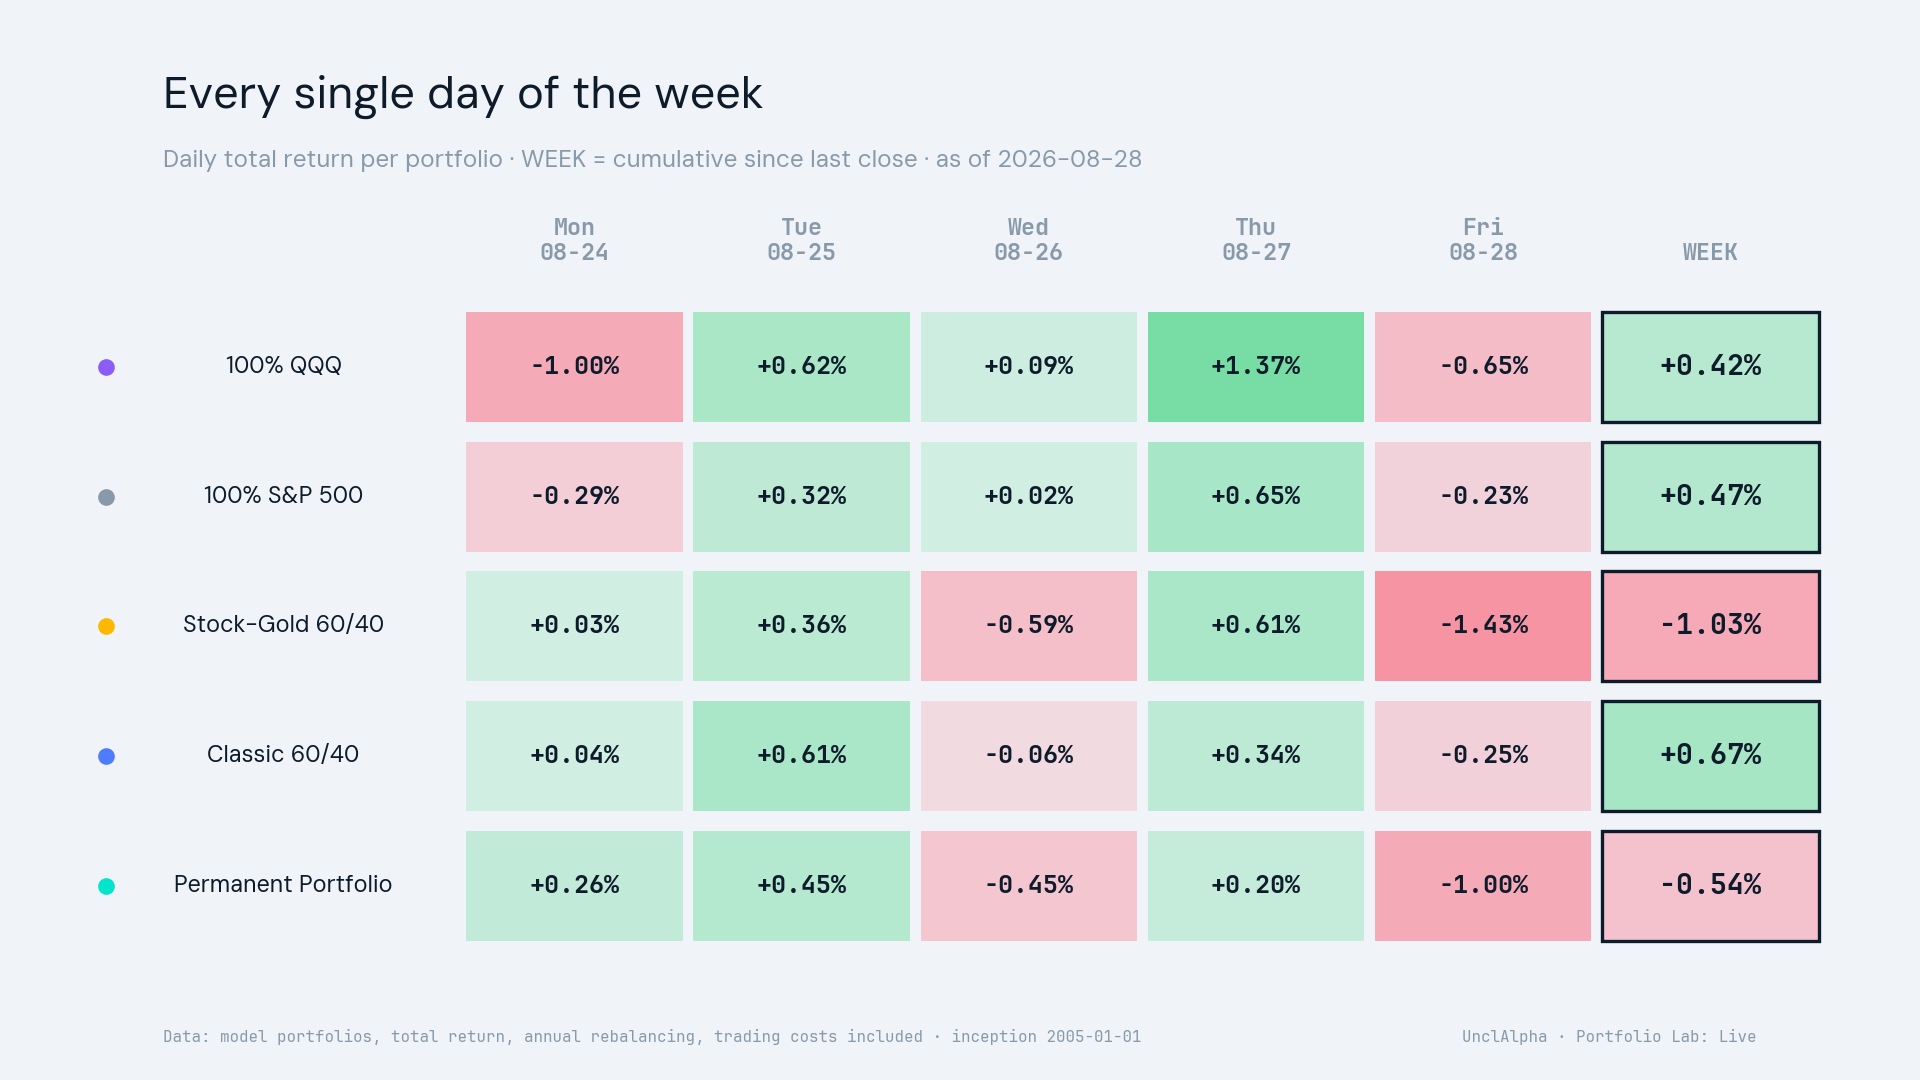
On 2026-08-28, all five public lines closed lower. The selected pair still looked different: Stock-Gold 60/40 fell 1.43%, while Classic 60/40 fell 0.25%, leaving one line below the week baseline and the other above it.
What This Week Actually Taught
This week, a diversifier became the visible source of drag while another balanced construction still looked positive. That is the uncomfortable lesson: diversification does not remove disappointment. It changes where disappointment can appear, and therefore what kind of patience a fixed rule may demand.
So, did the wrong portfolio get chosen? This week cannot answer that. Stock-Gold 60/40 created visible loss pressure by finishing below the prior close, while Classic 60/40 created giveback anxiety inside a still-positive week. The contrast shows different holder pressure, not proof that either construction is superior. The next scheduled observations are listed below; the same fixed rules will record what follows without predicting the result.
Audit Receipt
Public tracker receipt SHA-256:
993406a5e71085634094a4385acf40c39f15d84b9cac09bd2dd161041d9900f4.
Forward Calendar
The Job Openings and Labor Turnover Survey for July 2026 is scheduled for September 1, 2026 at 10:00 AM ET; Portfolio Lab will record the fixed portfolio paths after the observation exists (BLS schedule).
The Q3 2026 Broadcom earnings conference call is scheduled for September 2, 2026 at 5:00 PM ET; Portfolio Lab will record the fixed portfolio paths after the observation exists (Broadcom IR).
The Employment Situation for August 2026 is scheduled for September 4, 2026 at 08:30 AM ET; Portfolio Lab will record the fixed portfolio paths after the observation exists (BLS Employment Situation schedule).
Method And Limits
Data run through 2026-08-28. Portfolio Lab uses a hypothetical $10,000 starting amount from 2005-01-01, daily adjusted close with distributions reinvested, single-asset buy and hold, and annual rebalancing for multi-asset lines with a 0.1% drift threshold.
For another initial capital, multiply each dollar balance by the amount divided by $10,000. Dollar values scale proportionally; percentage returns, maximum drawdown percentages, and Calmar ratios stay the same.
This is educational model tracking with no actual holdings and not personalized investment advice. The event restores the information environment; it does not explain the portfolio move beyond the accepted mapping ceiling. The holder experience is a path-supported hypothetical scenario, not evidence of what real people did.
The tracker window starts after QQQ’s 2000-02 crash and includes a strong gold cycle and a severe bond bear market, so history should be read with those limits. Past performance does not guarantee future results. Full disclaimer: https://unclalpha.com/disclaimer