

“My QQQ just fell while Stock-Gold 60/40 rose. Did I choose the wrong portfolio?” That is the question behind this issue. When QQQ kept falling while the safer-looking path moved back above its weekly starting line, was that enough reason to switch? We will start with the screen that created the temptation, restore what was known at the time, and then test the feeling against construction and the longer record.
Wednesday closed with the kind of screen that can make a long-term plan feel suddenly wrong. QQQ slipped another 0.20%, its third decline in a row, and sat 2.05% below the prior Friday. Stock-Gold 60/40 rose 1.50% and crossed back to a 0.40% weekly gain. Two hours before the close, the Federal Reserve had released its July 28–29 meeting minutes. One reading rule matters for everything that follows: Portfolio Lab compares the paths that holders saw; it does not assign a daily move to one headline or forecast the next one.
The minutes showed that three voting members had favored a quarter-point rate increase. That made the disagreement inside the Fed concrete. Higher-for-longer rates can be uncomfortable for growth stocks whose valuations depend heavily on profits far in the future, while inflation uncertainty can be relatively friendlier to gold. That helps explain why the two portfolios carry different sensitivities—not why prices moved exactly as they did that afternoon.
The emotional comparison was still real. A hypothetical QQQ holder could see the week’s lagging line and feel regret: the neighboring portfolio had just supplied the buffer QQQ lacked. A hypothetical Stock-Gold 60/40 holder could feel relief and begin treating one rebound as proof that the buffer would keep working. Both temptations asked one close to answer a long-term question. At Wednesday’s close, Thursday and Friday were still unknowable.
Was this gap big enough to matter?
Resetting all five portfolios to the same prior-Friday baseline shows when the experiences separated. The question is not merely which line finished first, but how far apart the fixed rules looked while a holder still had to decide whether to stay with one.
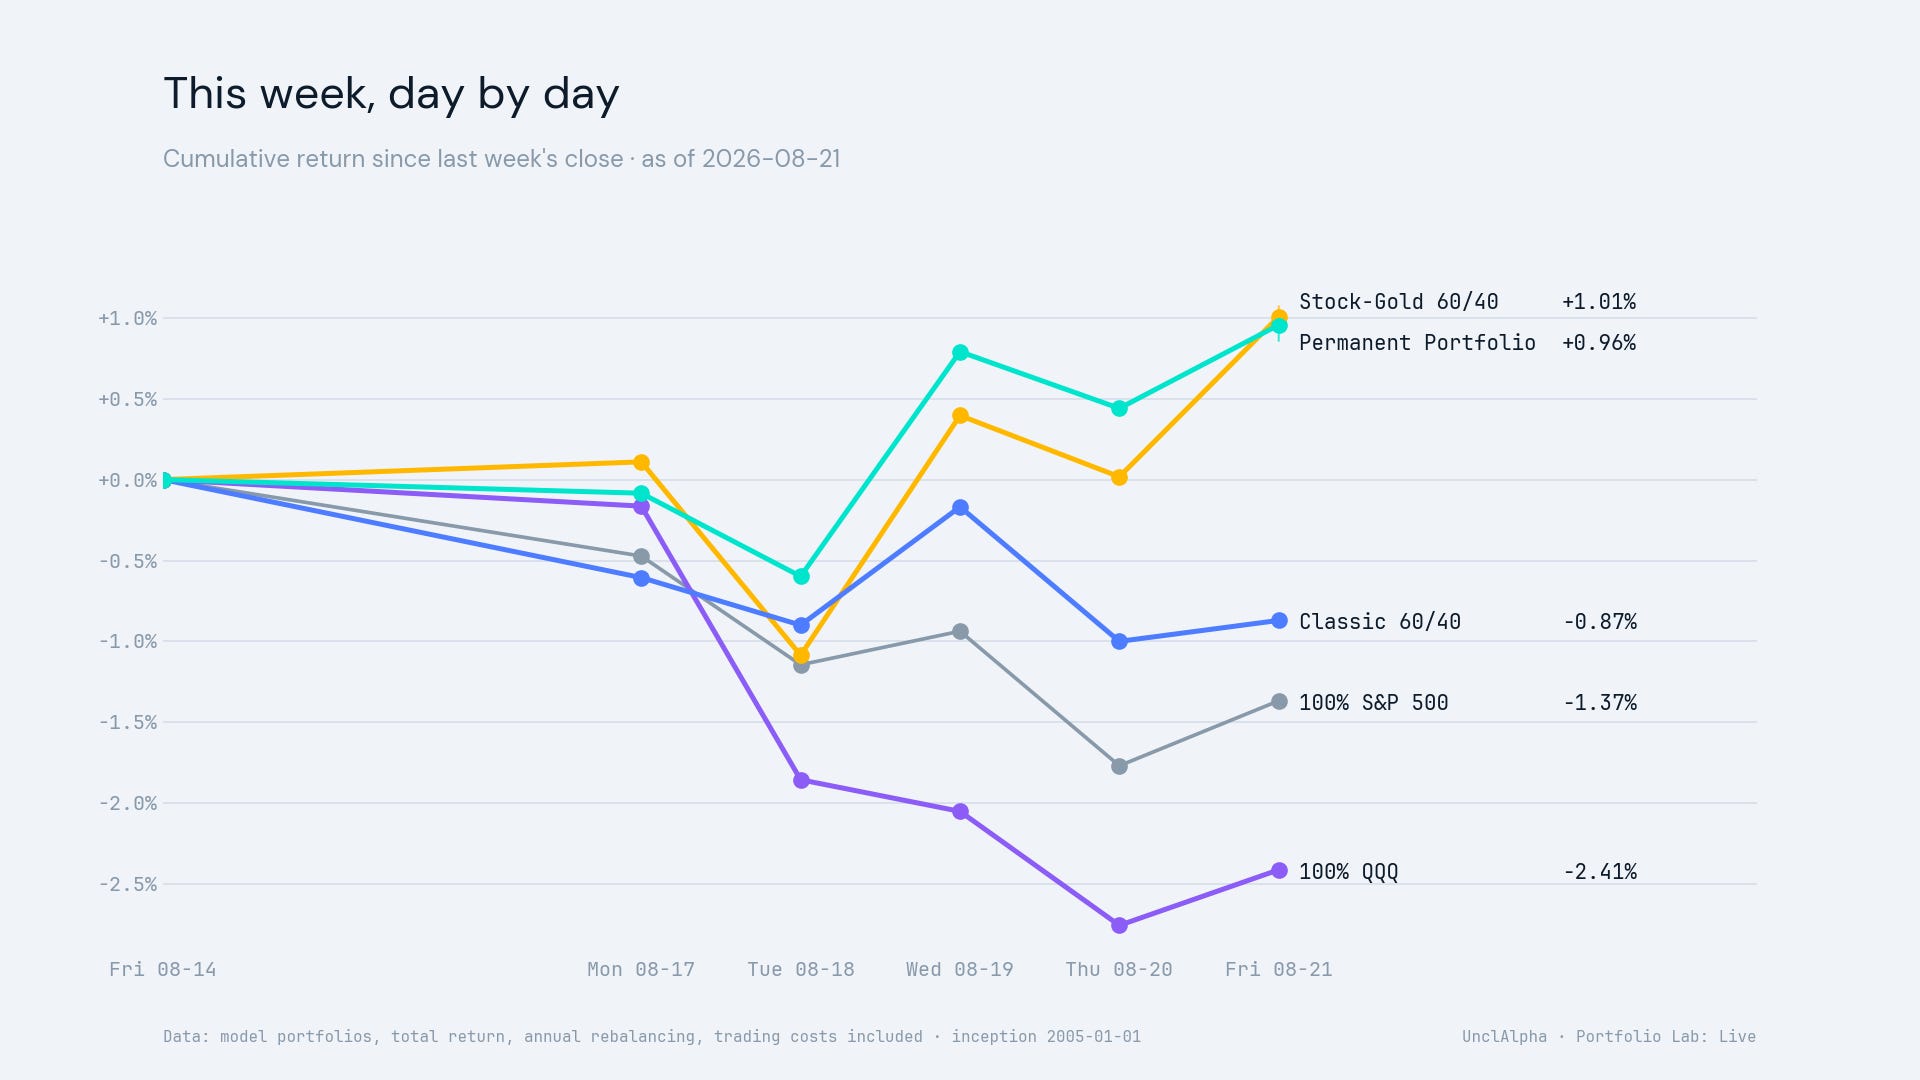
By Friday, Stock-Gold 60/40 was up 1.01% while QQQ was down 2.41%—a 3.42 percentage-point gap between the week’s leader and laggard. The S&P 500 line finished down 1.37%, Classic 60/40 down 0.87%, and the Permanent Portfolio up 0.96%. A gap that visible is exactly why switching can feel urgent; it is large enough to change the holder experience before it is large enough to settle the long-term choice.
The daily table narrows the comparison to Wednesday, when QQQ was the only declining public line. That same-clock view shows why the contrast felt sharper than the weekly totals alone suggest.
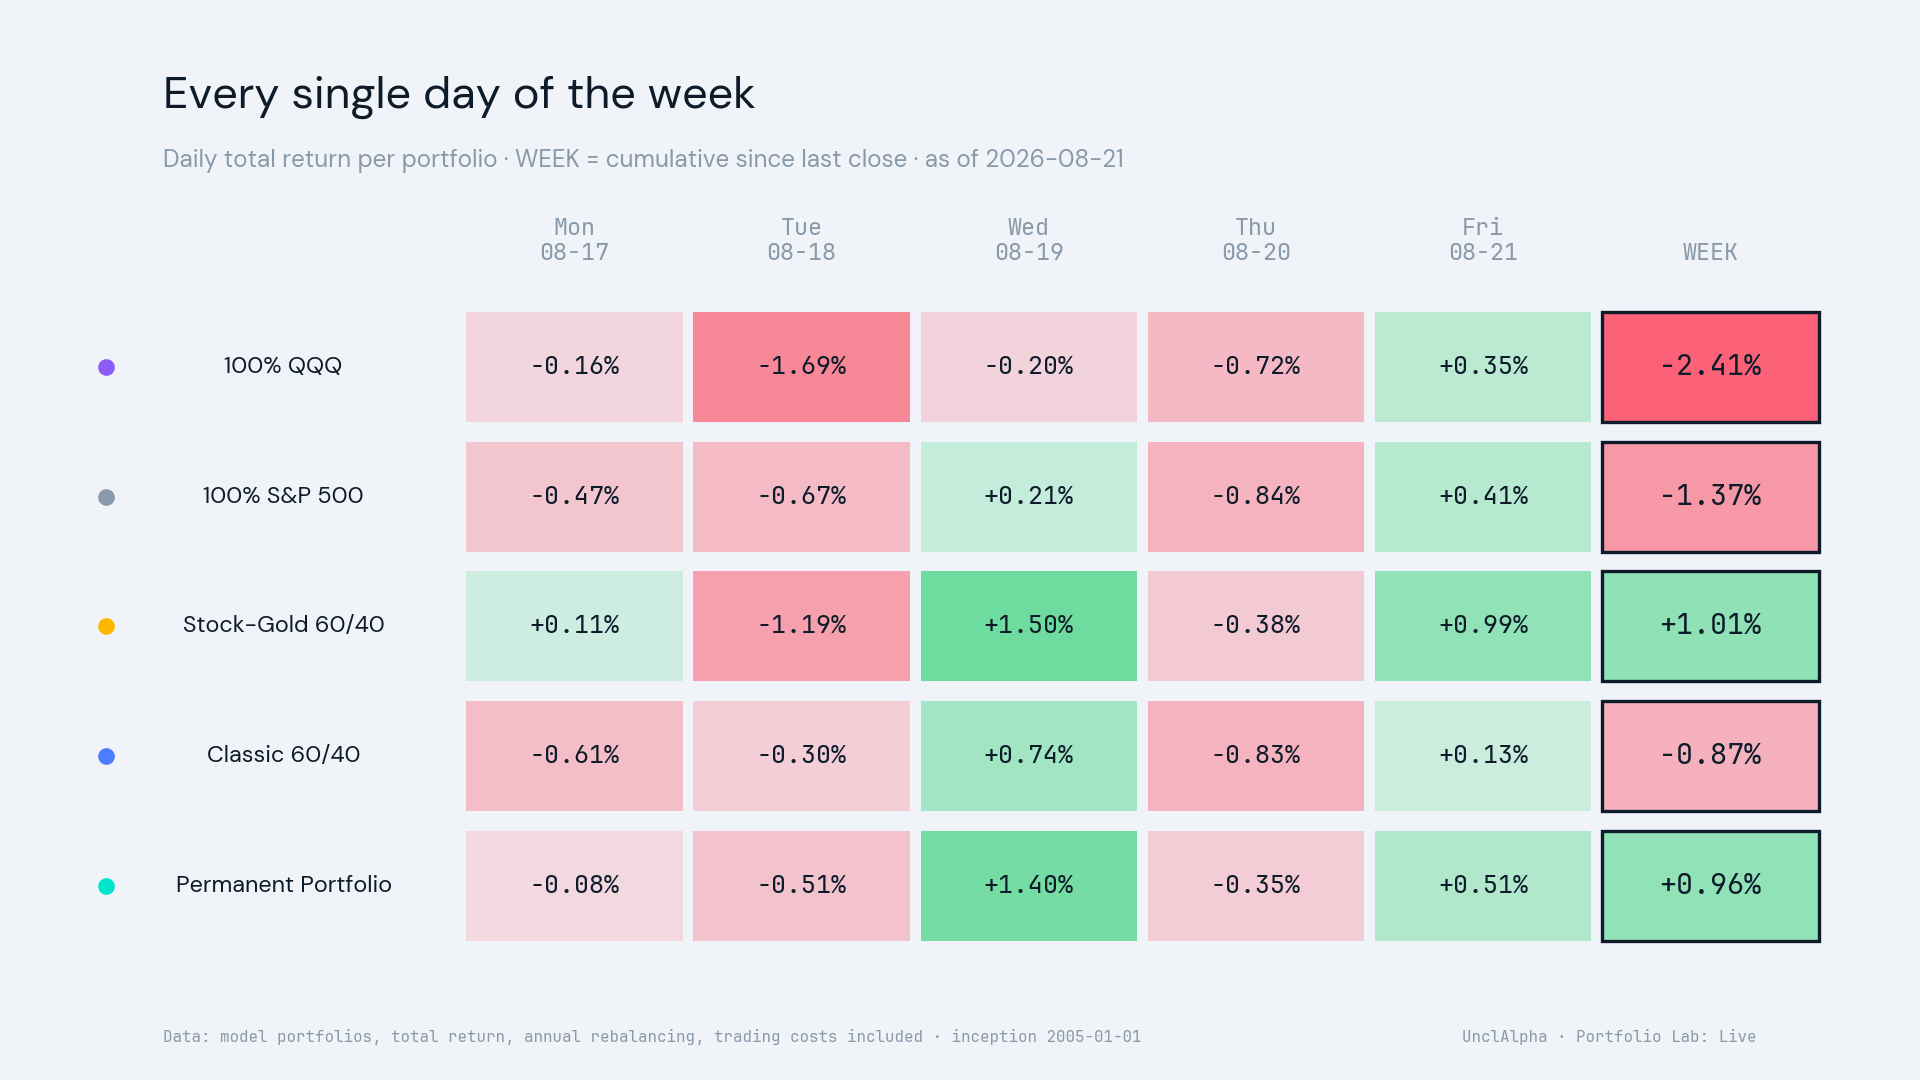
On August 19, QQQ fell 0.20%. The S&P 500 line rose 0.21%, Stock-Gold 60/40 rose 1.50%, Classic 60/40 rose 0.74%, and the Permanent Portfolio rose 1.40%. The screen did not merely show QQQ losing; it showed every alternative in the fixed experiment moving the other way.
Thursday made the pressure less comfortable, not the earlier choice more obvious. QQQ declined again, which could intensify the urge to abandon it. Stock-Gold 60/40 surrendered part of Wednesday’s rebound but remained just above its weekly baseline, which could weaken the confidence created by the buffer. The emotional bill changed with the next close; the portfolio rules did not.
Were these portfolios built to feel the same?
Portfolio Lab follows the same five models under the same rules every week: 100% QQQ; 100% S&P 500; Stock-Gold 60/40; Classic 60/40; and Harry Browne’s Permanent Portfolio. The first is concentrated growth equity. The selected stock-gold mix combines broad U.S. equity, growth equity, and gold. Wednesday exposed the trade-off embedded in those designs: concentration delivered more of the week’s growth-equity pressure, while the mixed construction supplied a visible buffer.
What changes when we zoom out to one year?
The trailing-one-year chart puts the week inside a common recent window. If Wednesday was only an isolated impression, the longer paths might tell a different story; if the construction trade-off persisted, both return and discomfort should appear in the record.
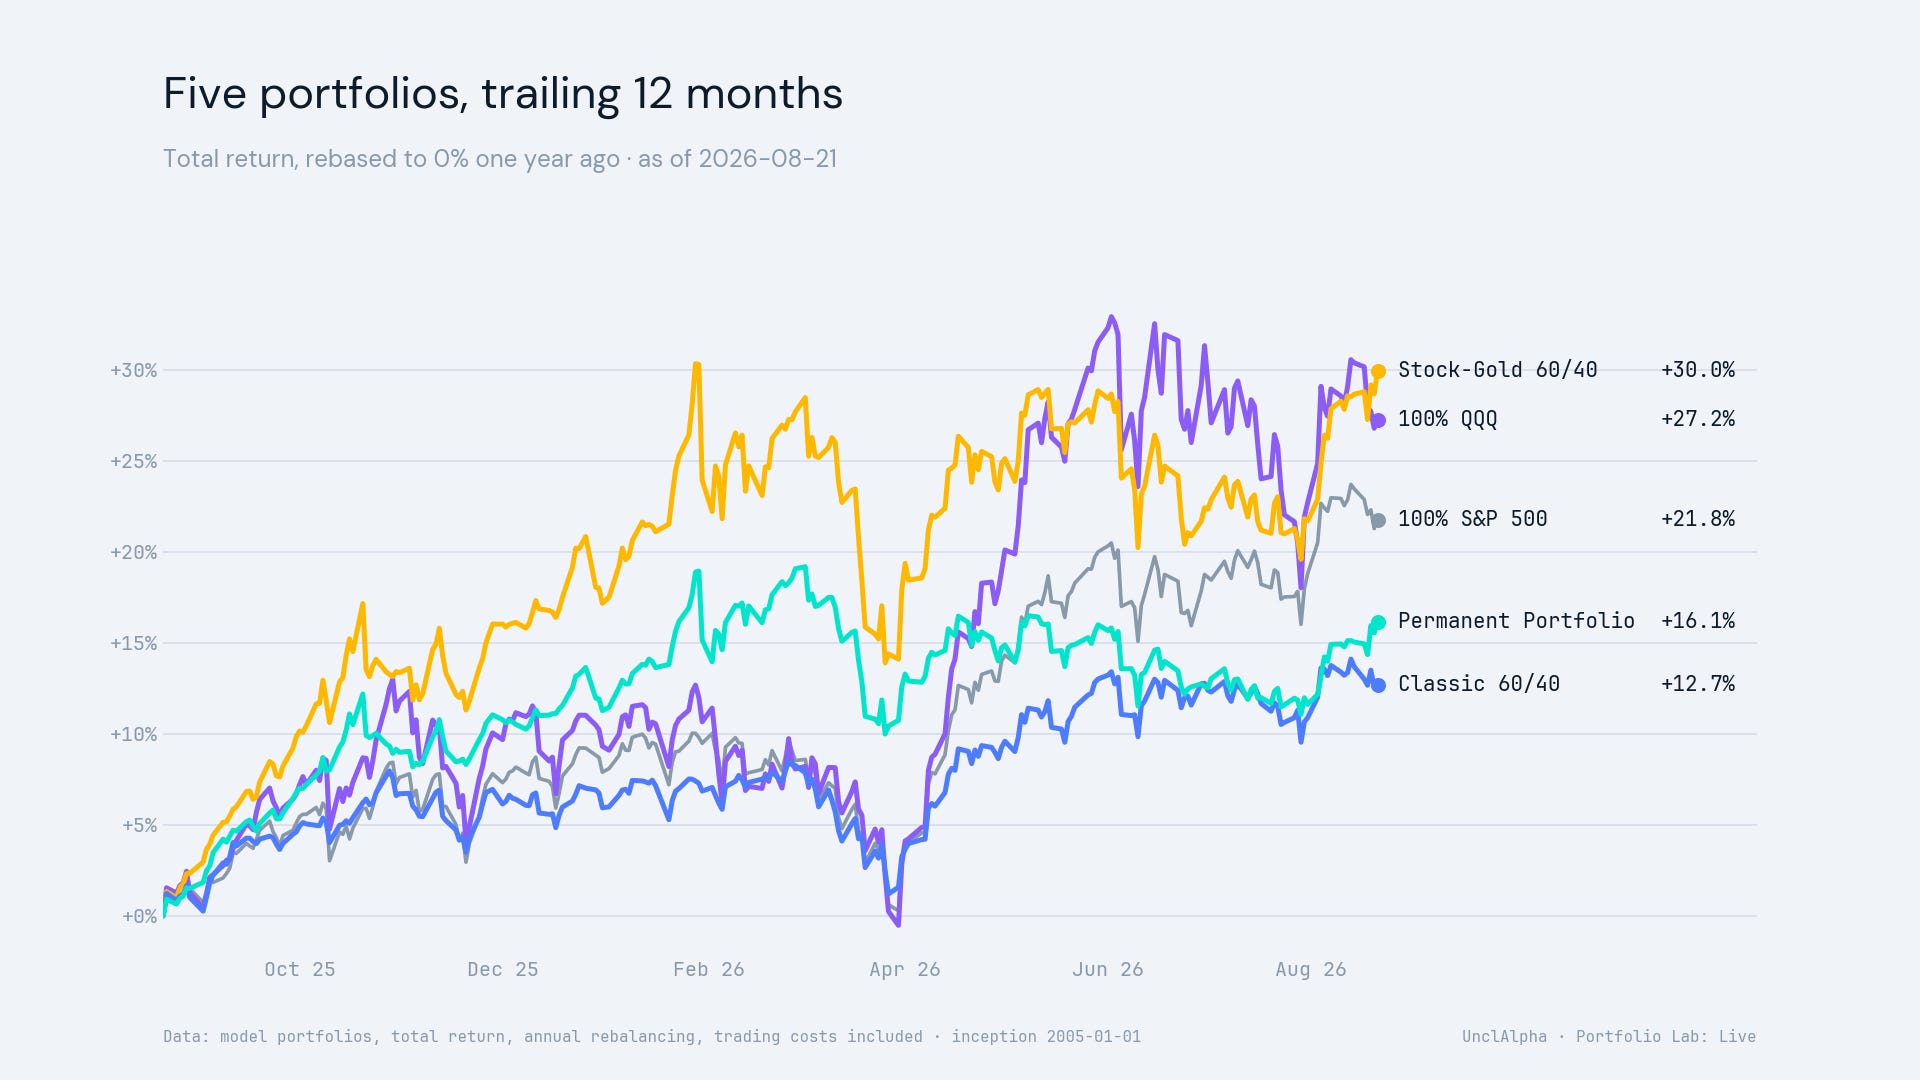
Over the accepted trailing year, Stock-Gold 60/40 returned 29.96%, versus 27.25% for QQQ. Its maximum drawdown over that same window was 12.61%, versus 11.96% for QQQ. In this particular year, the mixed portfolio finished with slightly more return and a slightly deeper worst decline. “More diversified” did not translate into a guaranteed shallower path; the trade-off changed with the window.
Does the longer history change the answer?
The scoreboard extends the comparison across the registered history. Calmar divides annualized return by the magnitude of maximum drawdown: a ratio of 1 would mean annualized return matched the deepest historical decline. It is best read as a compact description of one return-and-pain history, not as a grade for the portfolio.
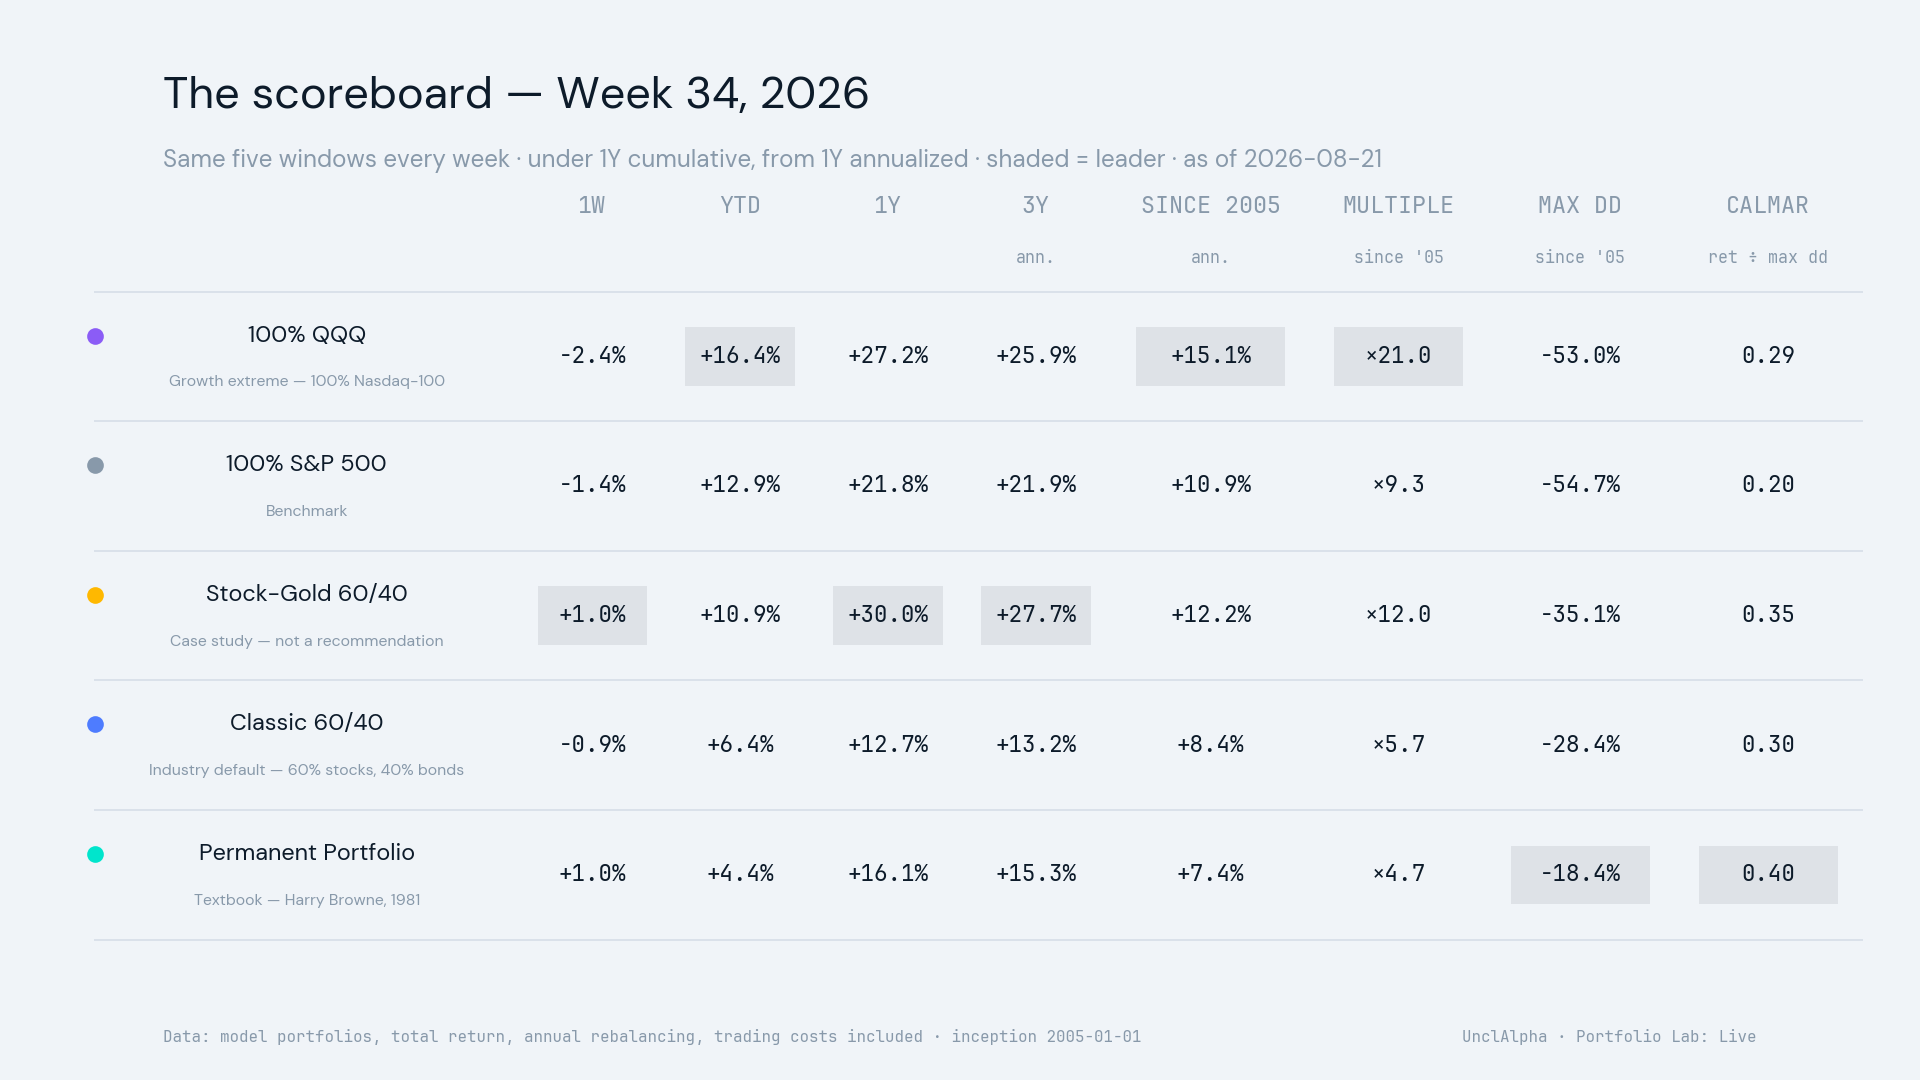
Since 2005, QQQ’s Calmar ratio was 0.29 and Stock-Gold 60/40’s was 0.35. In plain English, the mixed portfolio’s historical annualized return held up somewhat better relative to its deepest drawdown. QQQ produced the higher annualized return—15.10% versus 12.18%—but also the deeper maximum drawdown, 52.96% versus 35.07%. The numbers describe two different bargains with risk; they do not reduce either one to a winner or loser.
This week’s lesson
Portfolio construction changes the shape of temptation. Concentration can make a losing week feel intolerable; a buffer can make the neighboring portfolio look suddenly obvious. This week asked hypothetical holders to endure the moment when that emotional contrast began masquerading as long-term evidence.
Closing answer
So, did Wednesday’s safer-looking path justify switching? No single close did. QQQ’s concentrated growth exposure created regret and switching pressure as it lagged, while Stock-Gold 60/40’s equity-and-gold mix created buffer relief. The lesson was not which portfolio won. It was how quickly one week could make a long-term plan feel wrong—and why repeating the same fixed experiment helps us recognize that temptation before acting as if it were proof.
Audit receipt
For readers who want to verify that this issue uses the frozen weekly dataset, its public audit hash is 0d4bbbec103fe9ab84cfc776ec0859b9f8d8c9bd24fa429cd9c7f8e511467c82.
The next 7–10 days
The Census Bureau calendar schedules July New Residential Sales for August 25 at 10:00 a.m. ET.
The BEA calendar schedules both the second estimate of second-quarter GDP and Corporate Profits and July Personal Income and Outlays for August 26 at 8:30 a.m. ET.
As of the research cutoff, no S&P 500 or Nasdaq-100 constituent additions or removals were announced with an effective date inside the August 23–September 1 window. Portfolio Lab will add the resulting paths only after those observations exist.
Method and limits
Data run through 2026-08-21. Each model begins with a hypothetical $10,000 normalization base on 2005-01-01, using adjusted closes with distributions reinvested. Single-asset lines are buy and hold; multi-asset lines rebalance annually under the registered 0.1% drift threshold. For another starting amount, dollar-valued paths scale proportionally by the new amount divided by $10,000; percentage returns, maximum-drawdown percentages, and Calmar ratios remain unchanged. The common history excludes QQQ’s 2000–02 crash, includes a strong gold cycle and a severe bond bear market, and uses GLD rather than spot gold or gold futures.
Portfolio Lab: Live is educational model tracking with no actual holdings. It is not personalized investment advice, and past performance does not guarantee future results. Full disclaimer: https://unclalpha.com/disclaimer