

When markets rose, buying felt late. When they fell, holding felt reckless. Selling created the fear of a rebound; doing nothing created the fear of a deeper fall.
That was my early relationship with investing: every choice felt wrong. I could read the backtests. I knew the annualized returns, the maximum drawdowns and the values at the end. I knew what had won and what had lost. It still did not tell me how to live through the middle.
That was the gap I had missed. A backtest gives you the destination. It does not make you walk the path — and the path is the part your nerve actually has to survive.
So I stopped looking only at where portfolios ended, and started watching how they moved: what fell first, what recovered, and how the same market could feel completely different depending on what you held. That didn’t make uncertainty go away. It did something smaller and more useful: it gave a vague fear a name, a size and a set of reference points.
Portfolio Lab: Live opens that process to you — not to sell you a portfolio, but to let you watch how portfolios behave before your own money ever has to find out. Five model portfolios. The same hypothetical $10,000 start. The same rules. A fixed scoreboard every Monday. No actual holdings, no changing the portfolio rules after seeing how they performed, and no promise that one of these portfolios will solve investing.
The point isn’t to crown a winner at the finish line. It’s to watch, week by week, what each portfolio asks of the person holding it.
All five portfolios below started with the same hypothetical $10,000 in January 2005. Two now sit at opposite ends of the scoreboard. 100% QQQ is worth $202,130 today; it suffered a −53.0% maximum drawdown along the way. The Permanent Portfolio is worth $45,003, with a maximum drawdown of −18.4%. The ending values alone cannot tell you which experience you could have lived through.
Most backtests end in the past. This one continues in public. Let’s see what the middle looks like from the inside.
Educational model tracking — not investment advice, no actual holdings.
The five lines
100% QQQ — QQQ 100%. The growth extreme: what maximum concentration in tech-heavy growth looks like, feels like, and costs.
100% S&P 500 — SPY 100%. The benchmark everything must beat.
Stock-Gold 60/40 — 48% SPY · 12% QQQ · 40% GLD. A case-study allocation from the Lab’s backtest research — not a textbook standard, and not a recommendation.
Classic 60/40 — 60% SPY · 40% TLT. The industry default: the allocation more of the world holds than any other. The control group.
Harry Browne’s Permanent Portfolio — 25% S&P 500 (SPY) · 25% long Treasuries (TLT) · 25% short Treasuries (SHY) · 25% gold (GLD). The textbook “all-weather” classic, published 1981.
Two of these five share a name. The Stock-Gold 60/40 and the Classic 60/40 differ in exactly one decision — what the defensive 40% is made of, gold or bonds — and that single decision is a running experiment inside the experiment. You’ll watch it play out every week.
Where the Stock-Gold 60/40 comes from. The Lab’s earlier backtest used XAUUSD spot gold over 1999–2025. In that study, this allocation returned 11.8% a year against the S&P 500’s 8.3% — while its worst drawdown was −33.9%, versus roughly −55% for the index. The live tracker below uses GLD and starts in 2005, so its figures are not directly comparable with that earlier study. Sixty percent stocks for growth, forty percent gold for the years stocks want to hurt you. That earlier result earned it a spot on this scoreboard — as a specimen to study, not a product to follow. This column is its first public appearance in English, and now it has to prove itself forward, in public, every week.
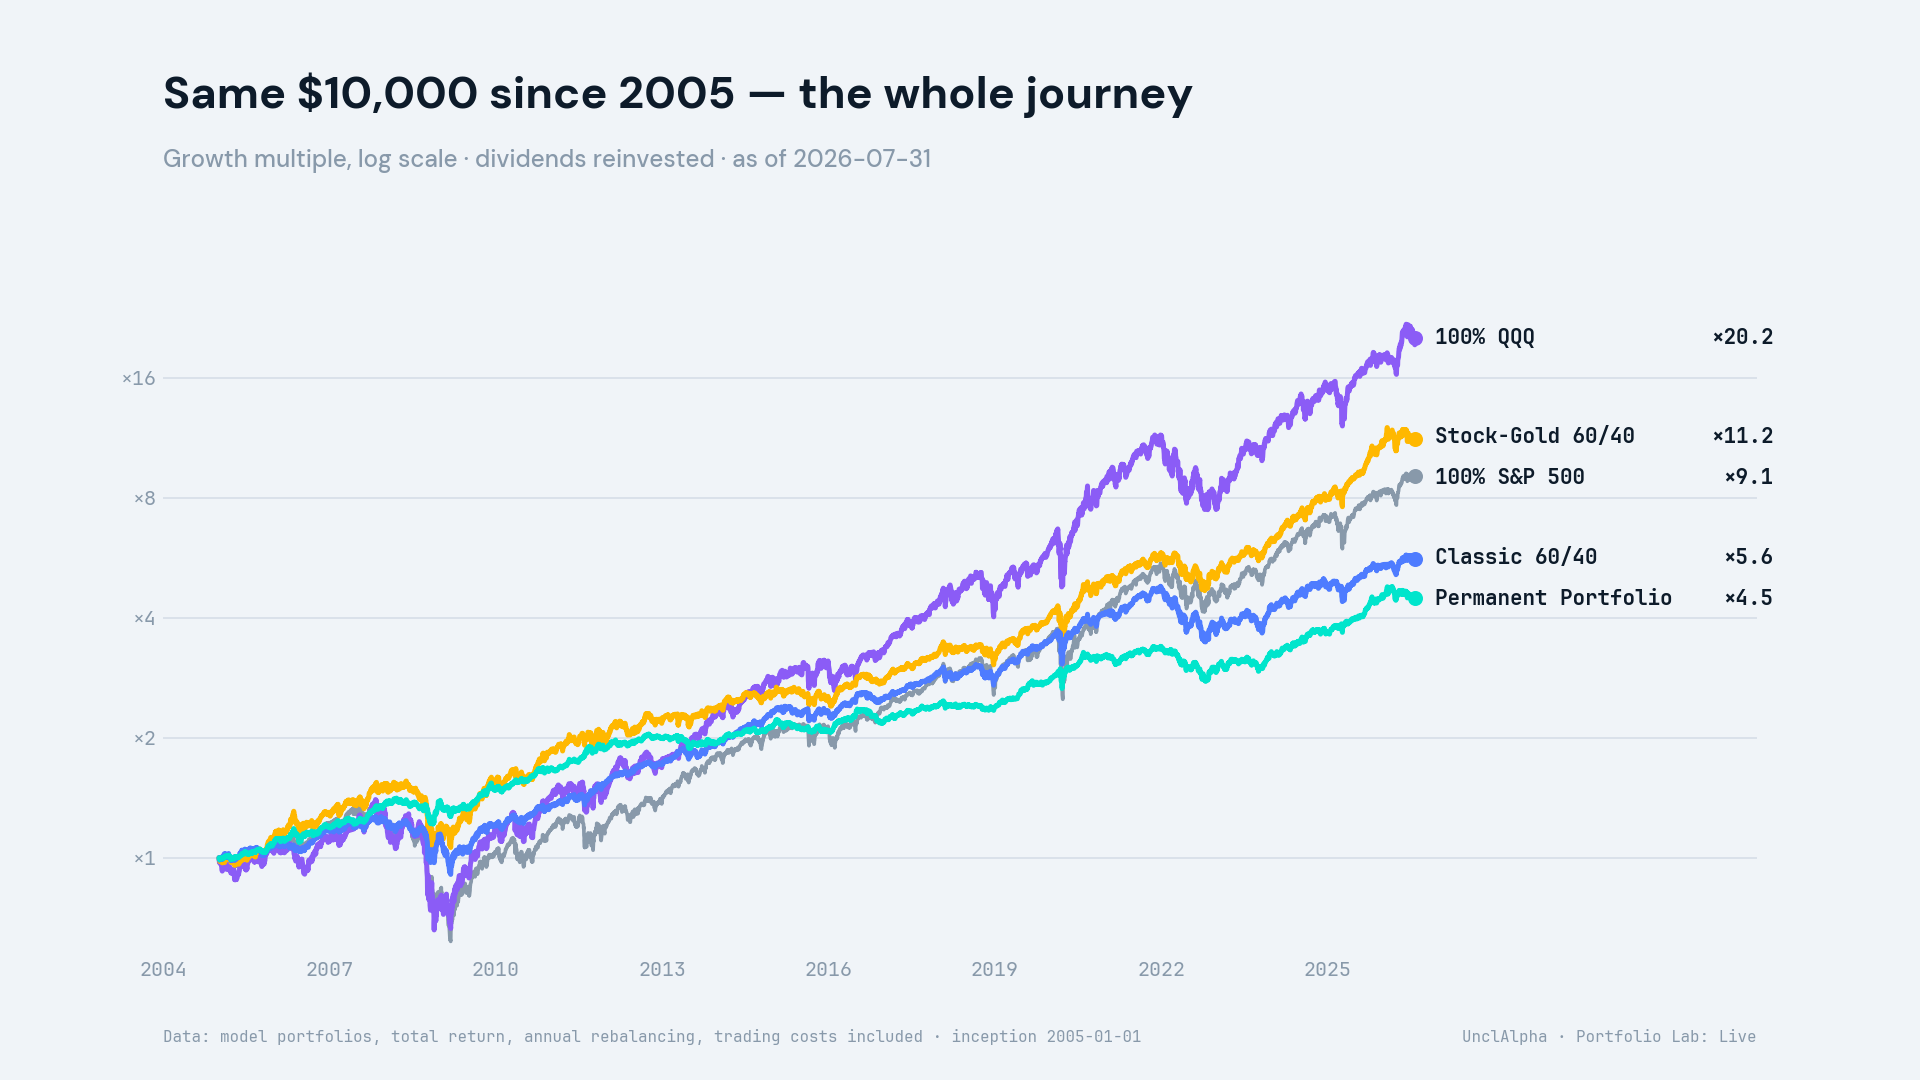
All five are ranked here by ending value. 100% QQQ leads at 15.0% a year, with one honesty note attached: QQQ’s worst disaster ever, the −83% dot-com crash of 2000–02, happened before this window begins. The Stock-Gold 60/40 made $112,472 (11.9% a year) with a worst fall of −35.1%. The S&P 500 made $91,122 (10.8% a year) and cost −54.7% in 2008–09 — the kind of drawdown that empties brokerage accounts through sheer panic. The Classic 60/40 made $56,344 (8.3% a year), cushioned to −28.4%. And the Permanent Portfolio closes the ranking at 7.2% a year — the least money, but the shallowest hole in the middle.
That’s the whole tension of portfolio construction in one chart — and the scoreboard below has a column that tries to measure it.
The scoreboard — Week 31, 2026
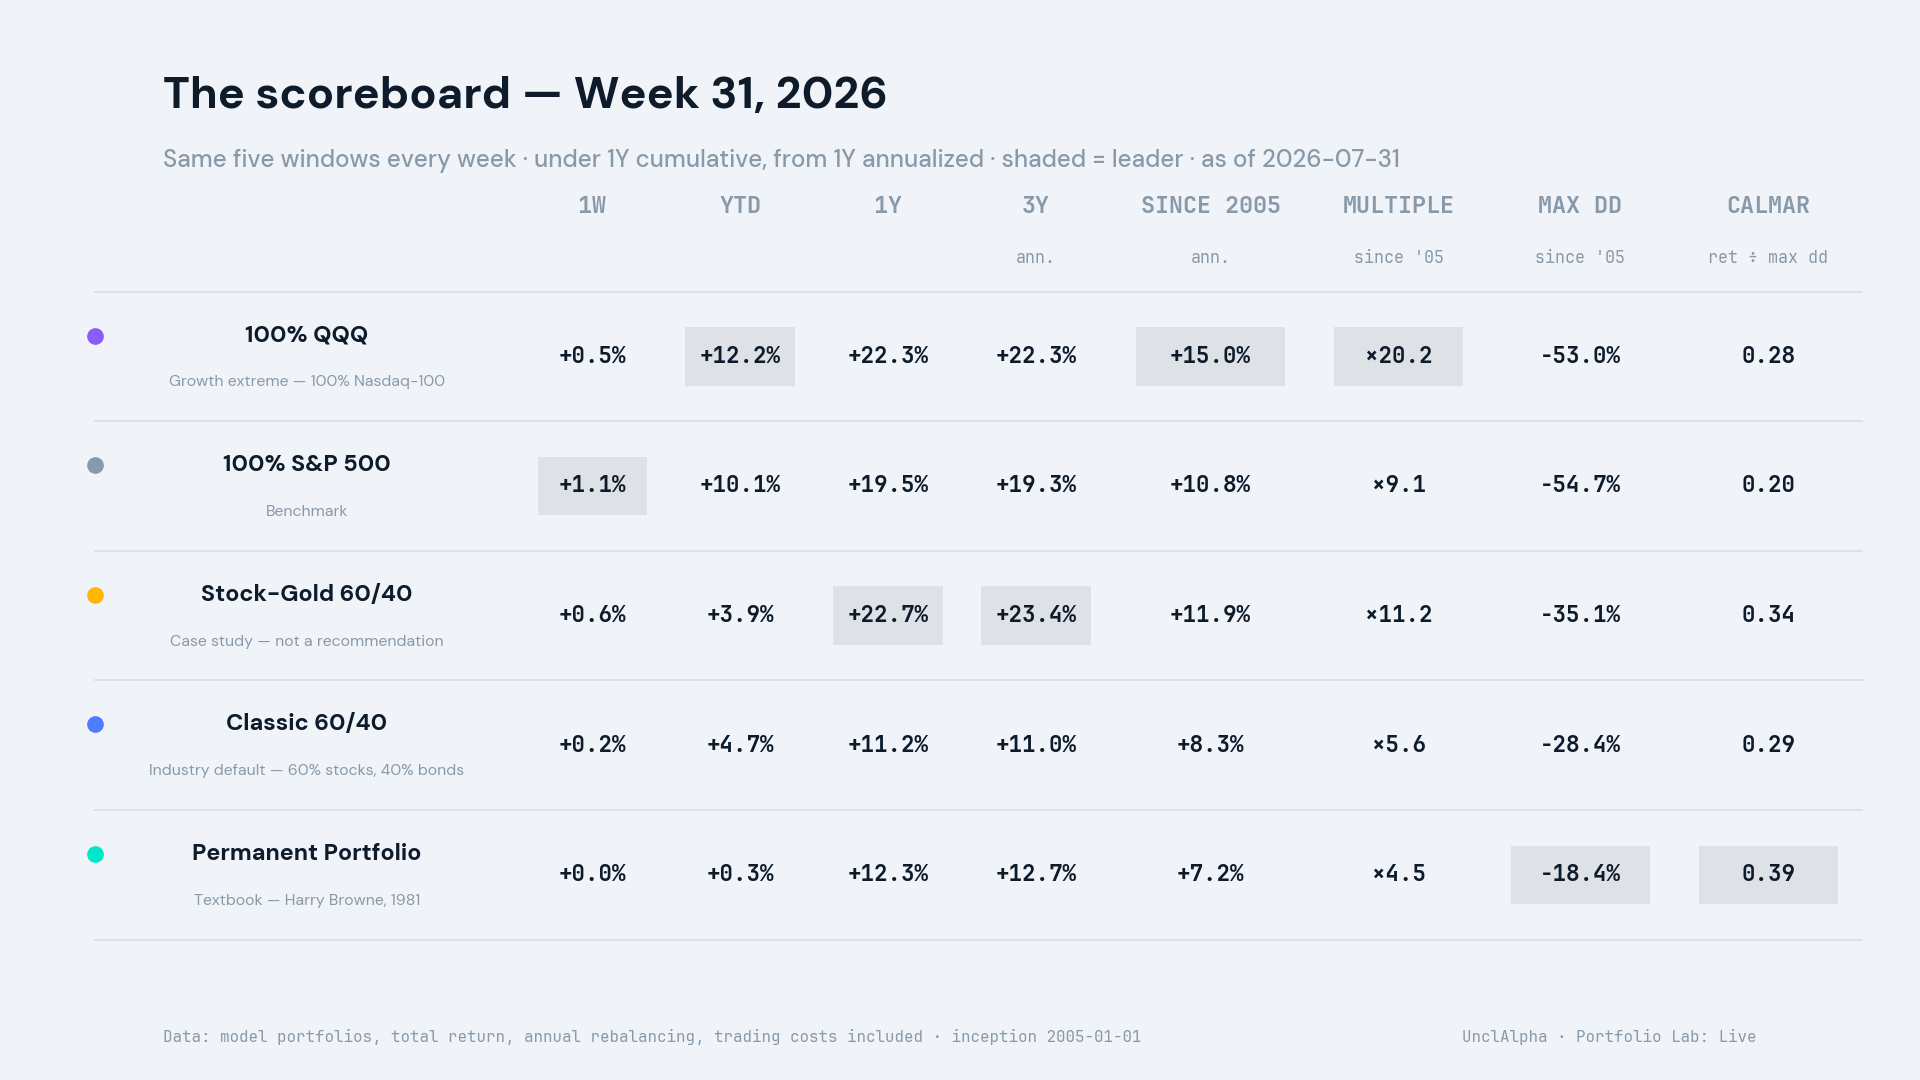
Read the shaded cells and you already know this column’s first lesson. QQQ owns year to date, the long-run return, and the ending multiple. The S&P 500 owns the week. Stock-Gold 60/40 leads the trailing one- and three-year windows. And the Permanent Portfolio owns the two columns nobody brags about: the shallowest maximum drawdown, and CALMAR, the verdict column.
Calmar is the honest referee of this table: annualized return divided by maximum drawdown — how much yearly growth each portfolio earned per unit of the worst pain it inflicted. Both ingredients are right there in the columns to its left; the only added step is the division. In the fixed display order, the readings are QQQ 0.28, S&P 500 0.20, Stock-Gold 60/40 0.34, Classic 60/40 0.29, and Permanent Portfolio 0.39. The 1981 Permanent Portfolio leads; the benchmark finishes last. The biggest pile of money and the most efficient pile of money belong to different owners.
The panel keeps the same shape every week — same five windows, same three structural columns, cumulative below one year, annualized above. A scoreboard that never changes shape can’t be used to flatter whoever happened to win this week. The format is the discipline.
The week under the microscope
Numbers summarize; days are what you actually live through. For this issue, both the scoreboard’s 1W column and the microscope use Friday, July 24’s close as their base, so the WEEK totals match the 1W column.
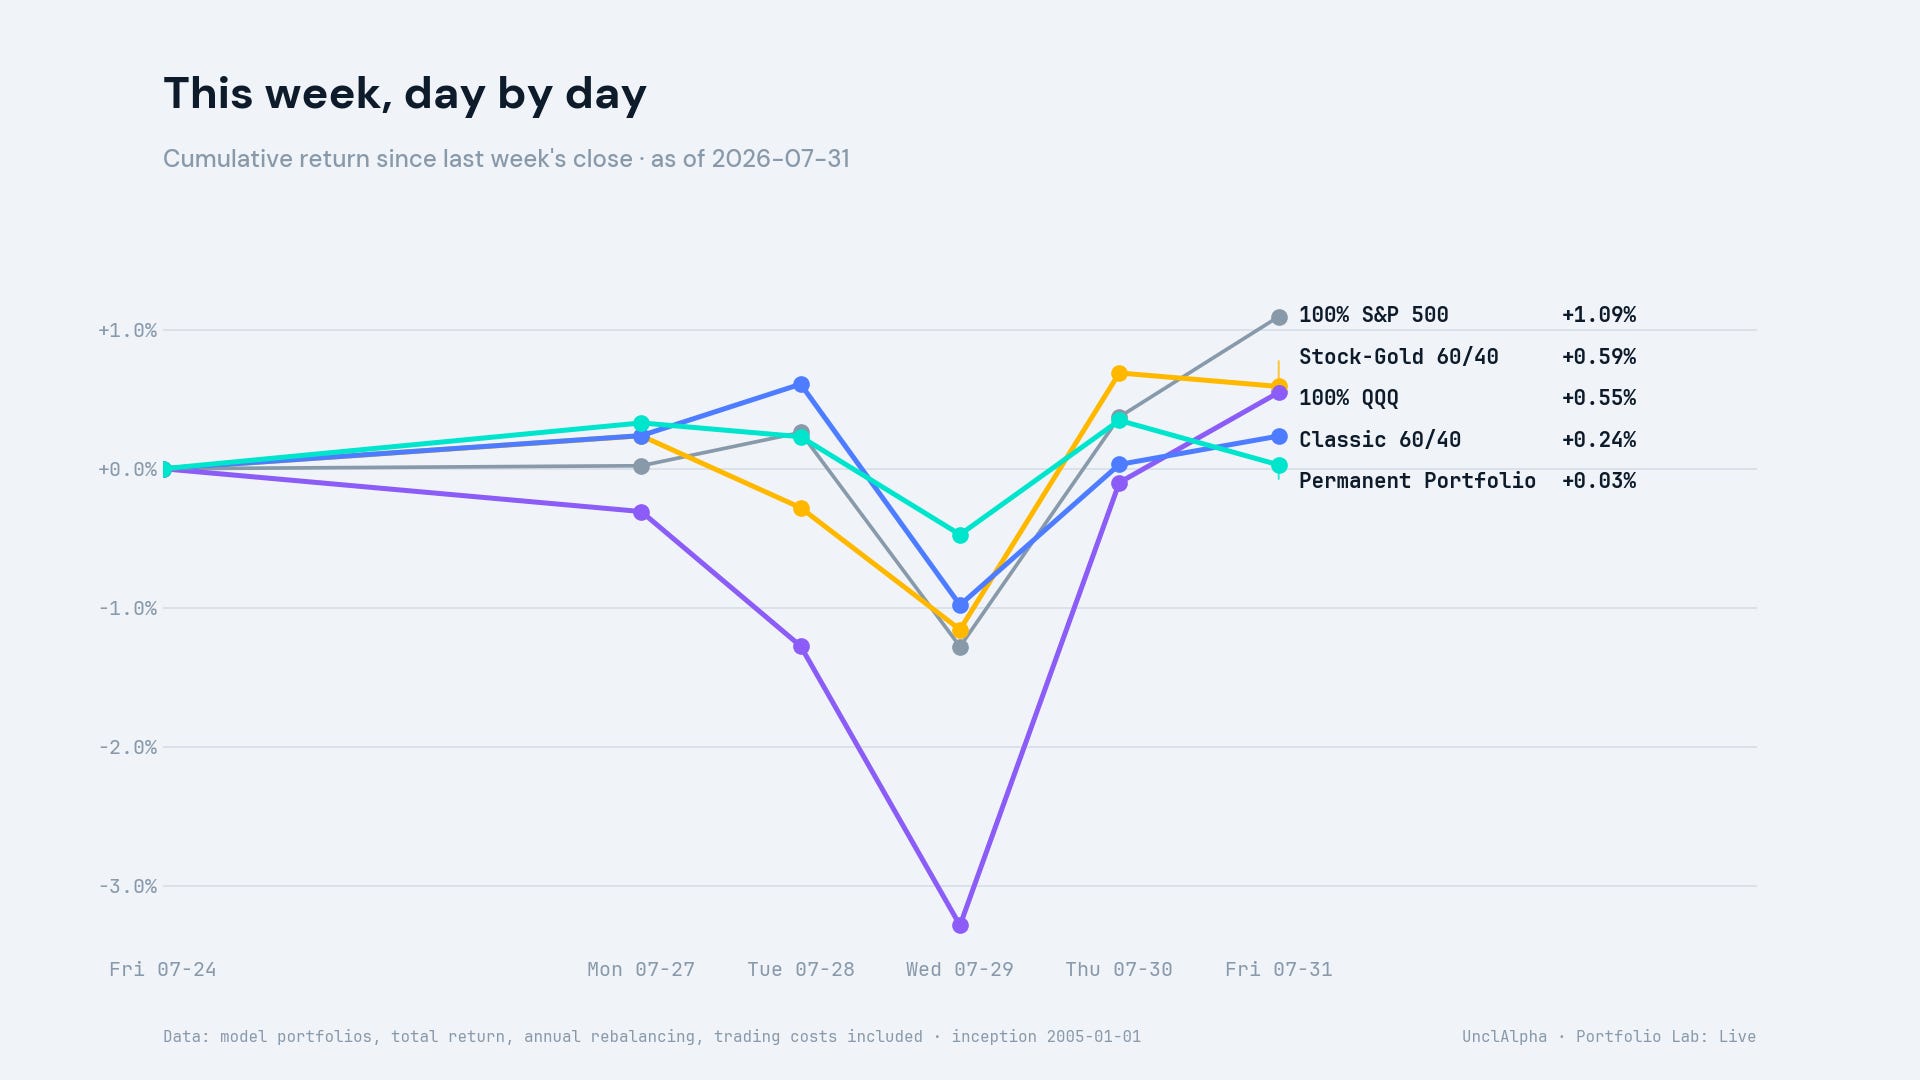
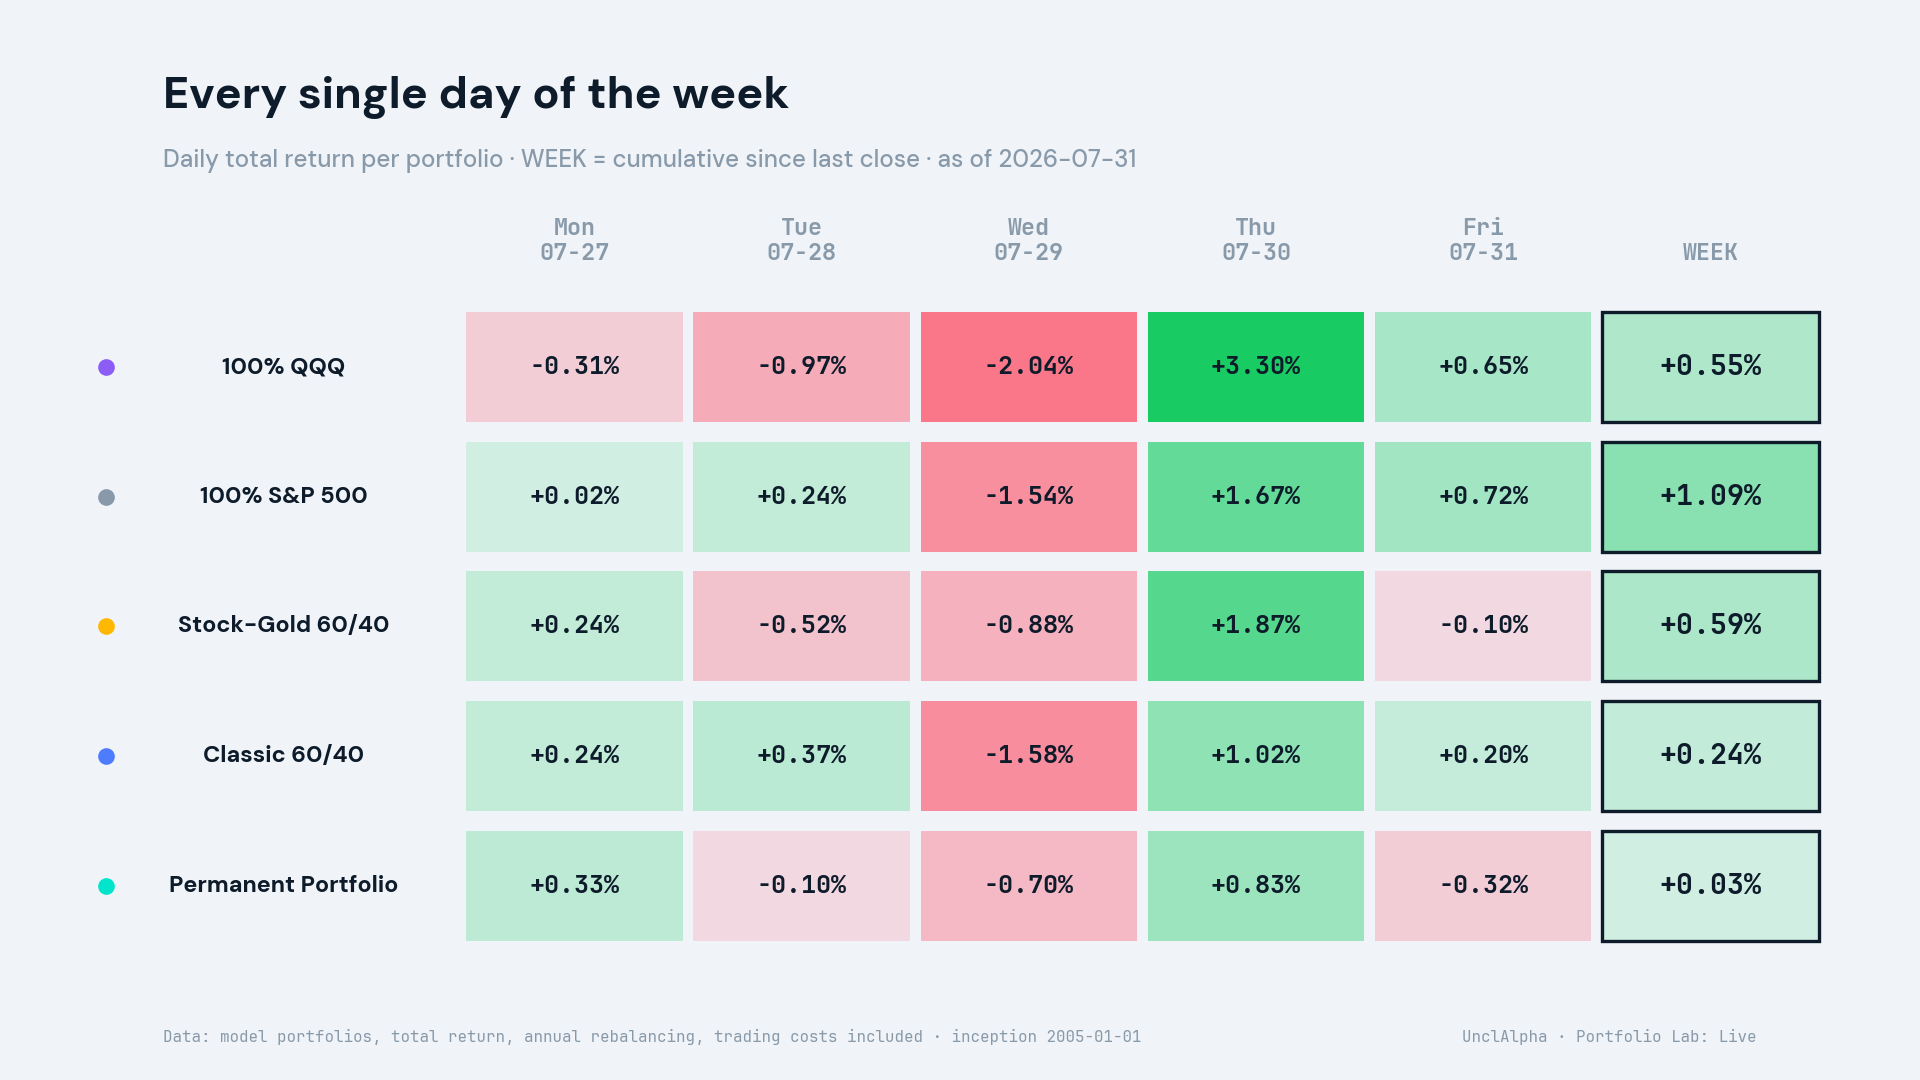
Notice what the color grid does to your stomach. By Wednesday’s close, QQQ was down 3.29% cumulatively from the prior Friday, while the Permanent Portfolio was down only 0.47% cumulatively. Then QQQ gained 3.30% in a single Thursday — one day nearly erased the previous three days’ decline — and every line finished the week above zero. The S&P 500 led at +1.09%; the Permanent Portfolio finished almost flat at +0.03%. If you only saw the weekly totals, the week looked calm. If you lived the days, it felt like a selloff followed by relief. Both are true; only one of them tempts you to do something unwise.
This week’s lesson: noise and signal disagree
Look at the scoreboard again. This week’s winner is the S&P 500. The trailing one- and three-year leader is Stock-Gold 60/40. The year-to-date and 21-year money winner is QQQ. The efficiency winner — return per unit of worst pain — is the Permanent Portfolio. Four different questions, four different champions, on the same data.
This is the lesson the Lab will repeat until it’s boring: short windows measure mood; long windows measure structure. Judge portfolios by weekly winners and you can end up switching week after week — collecting everyone’s drawdowns with no one’s compounding.
The sealed experiment
One more portfolio is already running in this lab — and you can’t see it yet.
It’s an 8-asset allocation the Lab optimized by machine — objective: maximize Calmar — on data from November 2003 through December 2022, and not touched since. Everything from January 2023 onward is out-of-sample: the model was frozen before any of it happened. Its full specification sits in a sealed document whose SHA-256 hash the Lab publishes today:
e3063e6874bd97767df5368a0ddd5846f0f6fed027e0faee1de96e78dec157deWhen the Lab’s paid bench opens, the Lab will publish the document; you hash it and check the match. Until then, the seal cuts both ways: no peeking, no tweaking, no performance quotes — not one number, good or bad. It is the one and only sealed portfolio in the Lab, its weekly results are archived in version control as they happen, and when it’s revealed you’ll see its entire record — in-sample and out — including everything it got wrong. The Lab pre-registered this experiment the way clinical trials do, because a track record you assembled in the dark is only worth something if you can prove you couldn’t cheat.
Audit receipt — 2026-W31
Data through: 2026-07-31
SHA-256:f6a135b4671fc8468d0de922538ccfd3a1ece69f4d752c496a8d626170e45500
This hash commits to the exact weekly snapshot, including the sealed experiment, without revealing its results.
The week ahead: what to watch
What to watch, not what to expect — this section lists scheduled facts and where they land on the bench. No forecasts, ever.
August 4, 10:00 AM ET — June JOLTS. The labor-market release lands across the broad-equity legs and the Treasury legs in the Permanent Portfolio and Classic 60/40.
August 7, 8:30 AM ET — July Employment Situation. The jobs report maps to every tracked equity leg and both Treasury-bearing portfolios. We will watch where the reaction appears, not forecast its direction.
What you’ll get every Monday
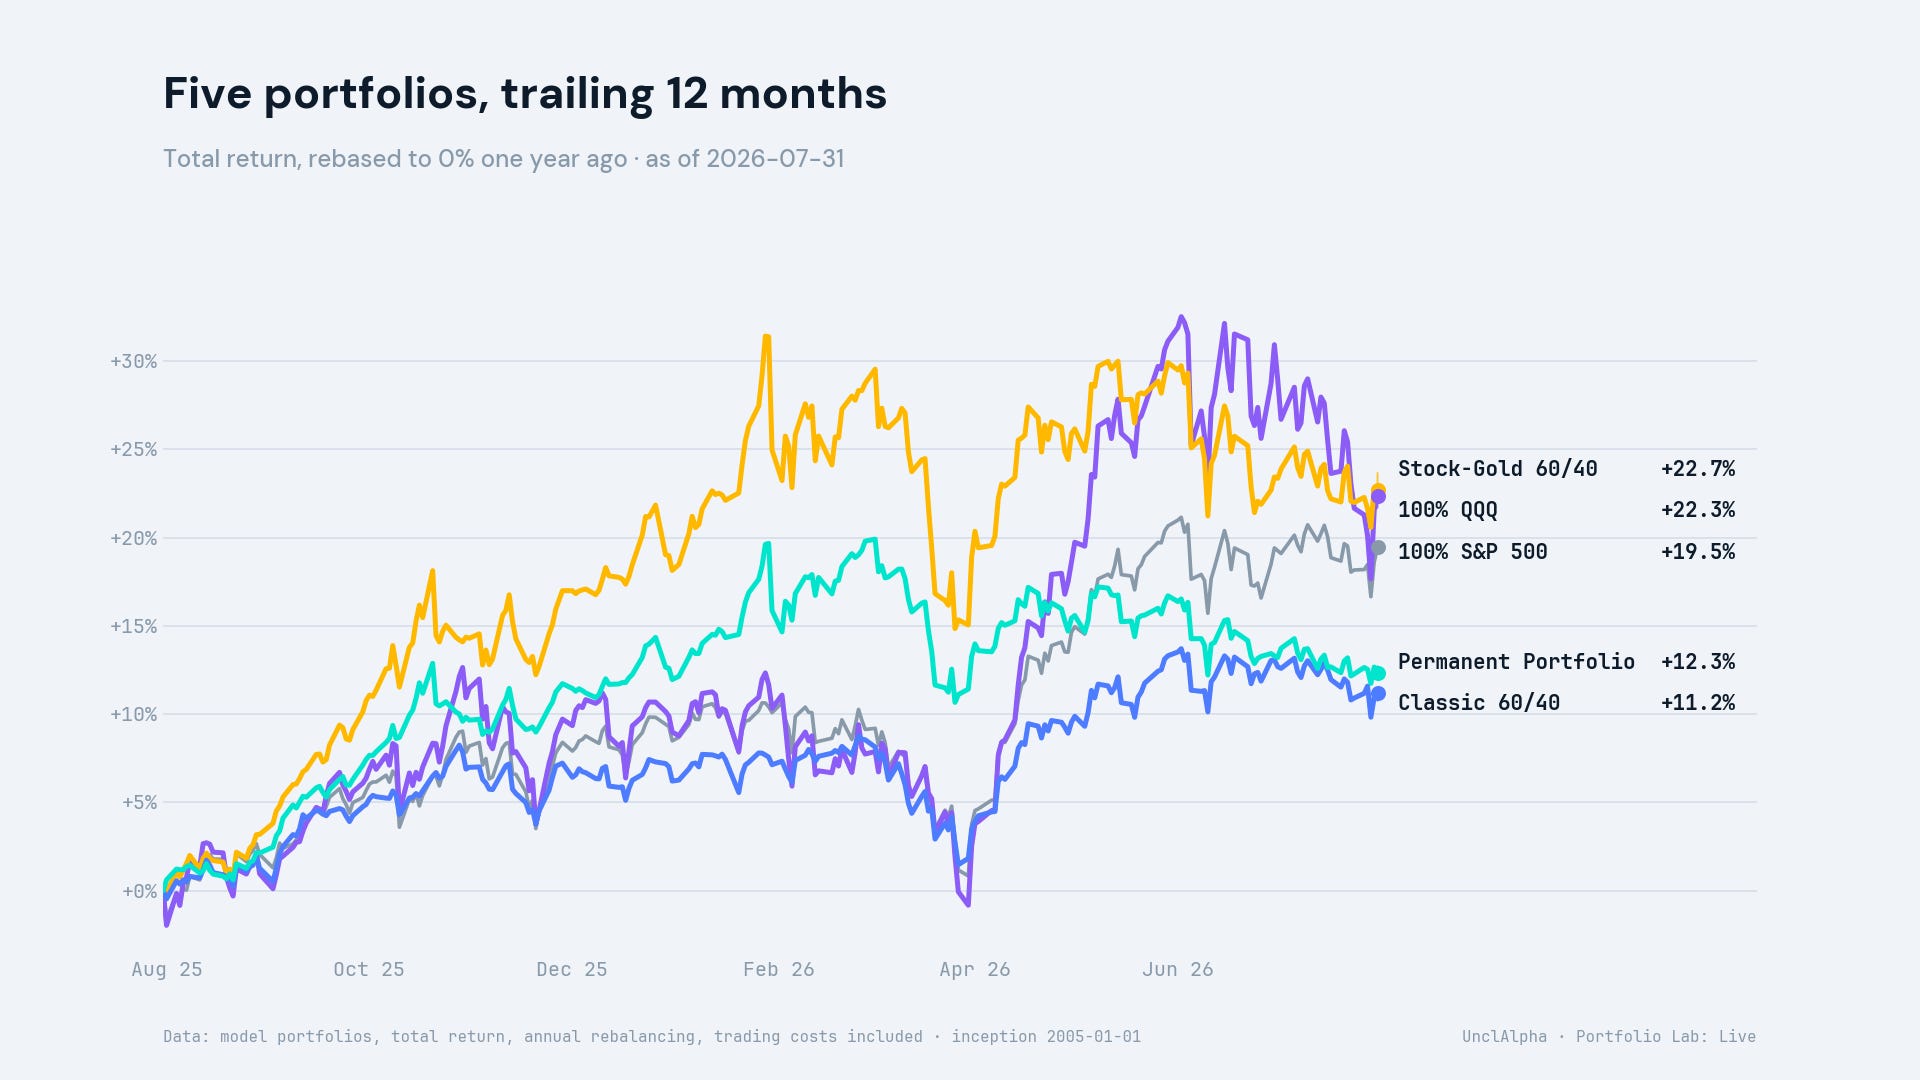
Every Monday, before the bell: the five-line scoreboard, the week under the microscope, the 12-month chart, one lesson drawn from what actually moved — and what to watch in the week ahead.
When the data earns it: occasional long-window or rebalancing specials. The fixed weekly issue remains the maintenance commitment.
Someday: the seal comes off.
If you want five portfolios’ worth of market behavior explained one honest week at a time, subscribe to this section — and bring a friend who has ever felt the urge to sell in a panic.
Extended methodology for this inaugural issue: the models start with a hypothetical $10,000 on 2005-01-01 — the first year-start after all component ETFs existed (GLD listed November 2004). Prices are total return, with dividends reinvested. Annual rebalancing uses a 0.1% drift threshold and includes an Interactive Brokers-style model for commission, slippage and market impact. Data are daily adjusted closes with dual-source checks. Returns below one year are cumulative; three years and since inception are annualized, and since inception also reports the cumulative multiple. Calmar equals annualized return divided by the absolute maximum drawdown, with no risk-free-rate assumption. This 2005–2026 window has been unusually kind to gold and unusually cruel to bonds, so the Stock-Gold versus Classic 60/40 comparison is window-dependent. Earlier long-horizon work may use XAUUSD spot gold for history; this tracker uses GLD, including its expense ratio and tracking difference.
Methodology: model portfolios, $10,000 hypothetical start on 2005-01-01, total-return (dividends reinvested), annual rebalancing, trading costs included. QQQ’s 2000–02 crash (−83%) predates this window. Full methodology for this inaugural issue: see the extended methodology above.
⚠️ Educational model tracking — not actual holdings, not investment advice. The Stock-Gold 60/40 is a case-study allocation from the Lab’s backtest research, not a recommendation. Past performance does not guarantee future results.