Is the $1,000 Newborn Investing Account Actually a Good Deal? I Ran 33 Years of Numbers.
The new $1,000 newborn account, backtested against 33 years of the S&P 500 — plus three checks to judge any long-term plan.

The U.S. government just created an account that drops $1,000 into an S&P 500 index fund for every eligible newborn. Four million kids are already signed up.
So I did what this lab does. I ran the numbers.
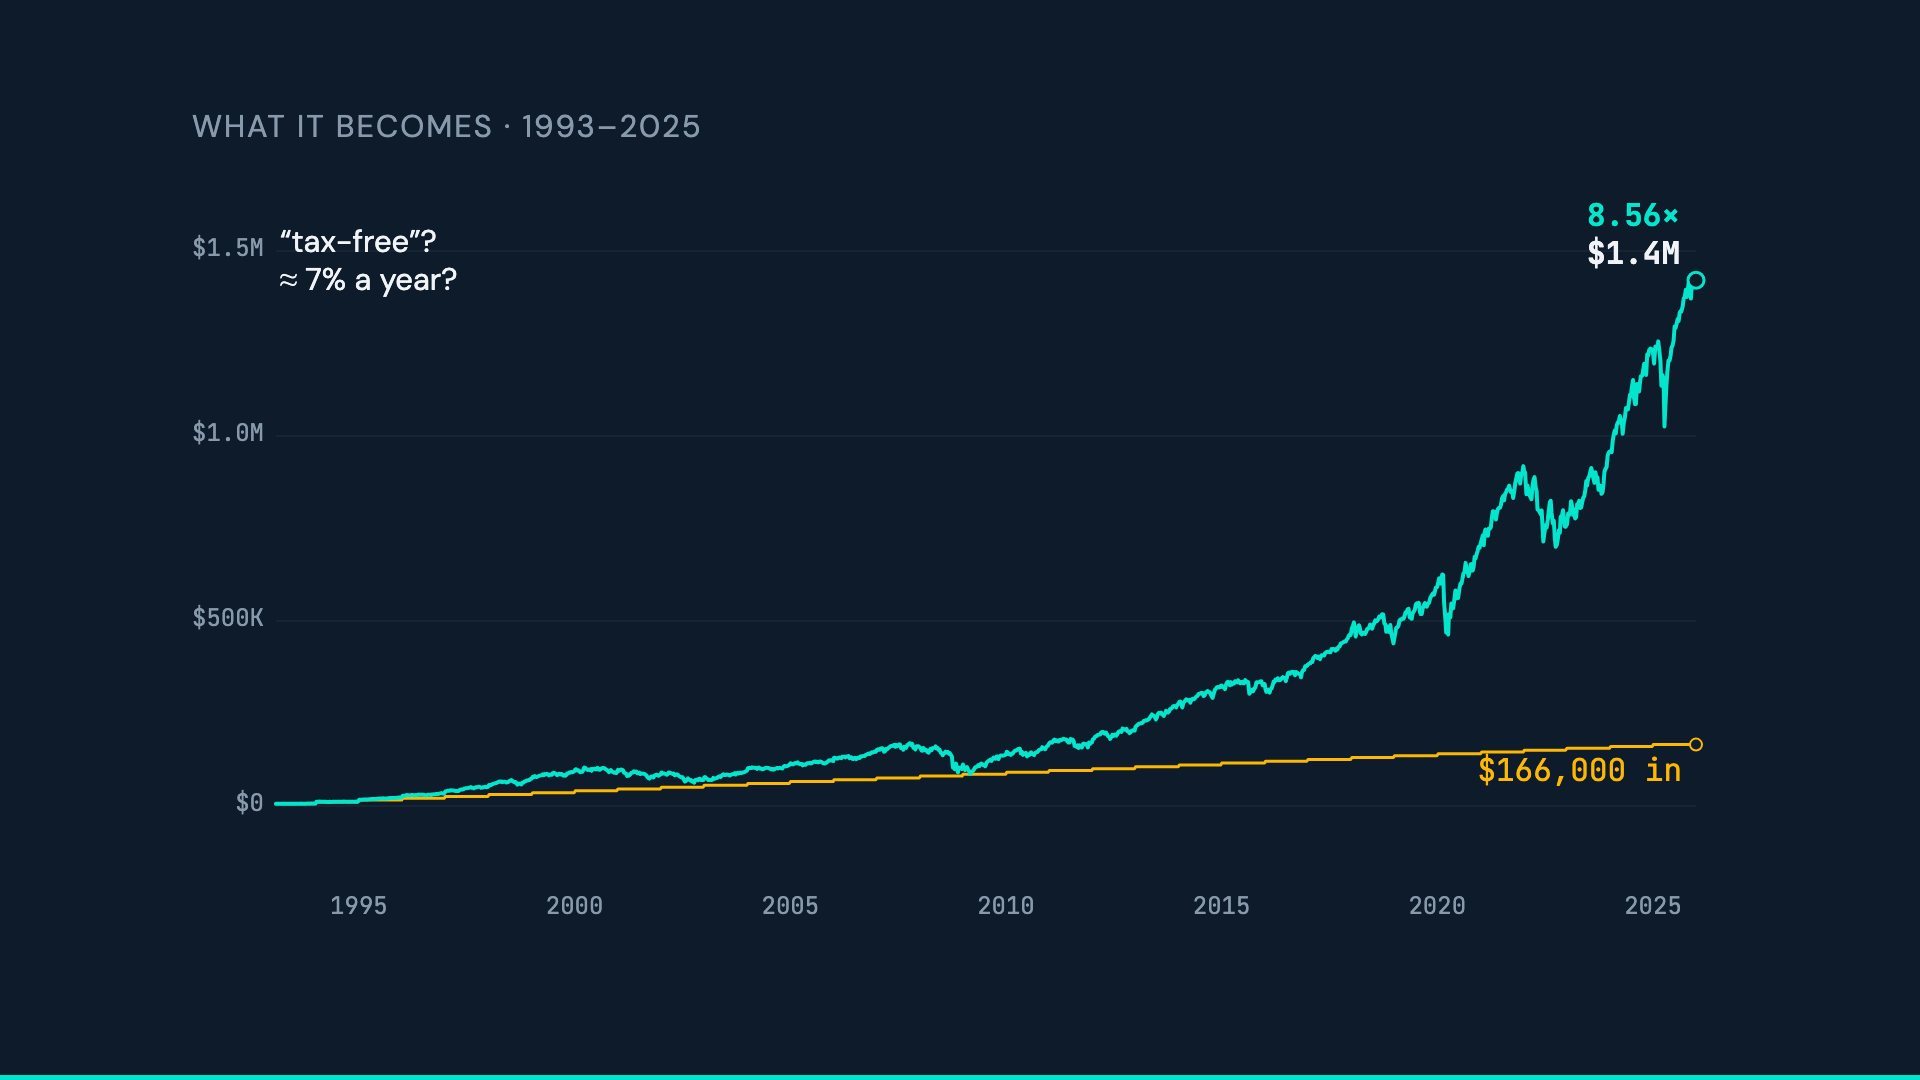
I took that $1,000 seed, added $5,000 a year — the legal maximum — and tested it against 33 years of real market history (1993–2025). Total you'd put in: $166,000. Where it ended: $1.42 million — more than eight times the cash you contributed.
But two things about that result aren't what they seem. People call this account "tax-free." It isn't, really — and that changes how you'd use it. And the return looks modest, about 7% a year — but that only tells half the story.
I'm Uncle Alpha, and this is Alpha's Backtest Lab. Quant-trained, simply explained.
By the end, you'll have three checks to judge any long-term plan — and a straight answer on whether this account is actually a good deal.
Quick note: this is educational, not financial advice. Past results don’t predict the future, and every figure here is nominal — before inflation.
> ▶️ Prefer to watch? Full video breakdown:
The return isn't 7%
You probably did the quick math: $166,000 in, $1.42M out, over 33 years — about 7% a year.
That's the wrong tool. Simple division assumes every dollar was invested for the full 33 years. Yours went in gradually — on average, each dollar only compounded for about half that long. Credit a dollar for 33 years when it really worked for 16, and the rate comes out artificially low.
Measure what each dollar actually earned — weighted by when it went in (the money-weighted return) — and the real rate is about **10.5% a year**. Right in line with what the market itself returned over the same stretch.
Could you do better? Sure — money invested earlier compounds longer. But a newborn isn't handed a lump sum; the account is built $5,000 at a time. That habit alone turned into $1.42M.
Think of a backtest like a flight simulator: you run the plan through every real crash and boom before risking a dollar. So let's talk about the crashes.
A 50% crash barely touched the money you put in
Over these 33 years, the account did fall hard. At the worst of 2008, it dropped about 50% from its peak. Cut in half — on paper.
But here's what that number hides. Measured against the actual cash you'd contributed, the account dipped below it on just 15 days — out of more than 8,000 trading days across 33 years. And the worst it ever got, at the very bottom of the 2008 crash, was about 5% under.
Sit with that. A 50% paper drop — but on the money you actually put in, you were never more than ~5% down, and almost never down at all.
That flips what "risk" means here. A crash mostly gives back gains. It barely touches your contributed savings — and only for a moment, near the very bottom.
Most of the money showed up at the very end
Seventeen years in — past the halfway mark — the account held less than a tenth of its final value. More than half of the entire $1.42M appeared in just the last five years.
That's how compounding works. The boring middle, where nothing seems to happen, isn't failure — it's the setup. The people who win aren't smarter; they just don't quit before the payoff.
In fact, your contributions were only about 12% of the final pot. The market did the other 88%.
Three checks for any long-term plan
Steal these. You can run all three yourself.
1. Judge by what each dollar actually earned — the money-weighted return — not the headline number. When someone shows you a backtest, ask how they counted the money going in.
2. Watch your balance against the cash you've put in, not its all-time peak. A drop from the peak just gives back gains. A drop below your contributions is the only one that should worry you.
3. Remember what drives the result: how much you add, and how long you stay — not when you buy, or how often.
Scared of starting at the wrong time? History is oddly reassuring. The worst entry point ever recorded was right before the 1929 crash — and even that investor made money over the long run, as long as they stayed in. No 20-year or 30-year stretch in this index has ever lost money. Not one.
The "tax-free" label is wrong
Back to that "tax-free" tag. It's not right. This account is tax-deferred: it grows without yearly taxes, but when the money comes out, the gains are taxed as ordinary income. For the money your family puts in, that can actually be worse than a normal brokerage account.
So the account isn't magic. Its real value isn't a tax break — it's three things: a free $1,000 head start, a structure that forces the habit, and decades of compounding left alone. (That seed by itself grows to about $28,000. The seed is the spark; the habit is the engine.)
One honest caveat: the last 33 years can't promise the next 33. This is one path, in U.S. stocks, before inflation.
Bottom line
If there's an eligible newborn in your life, the data's lesson is simple: don't chase a return. Start the habit, keep it automatic, and let time do the heavy lifting — that's where almost 90% of this came from.
Aim right. Stay long.
Next time: if you've got a lump sum, is it smarter to invest it all at once, or ease it in? That flips the math. Subscribe and I'll see you there.
— Uncle Alpha · Quant-trained, simply explained.
> ▶️ Watch the full breakdown on YouTube:
*For educational purposes only. Not financial advice, and not a recommendation to buy or sell any security. Past performance does not guarantee future results. Full disclaimer: unclalpha.com/disclaimer