

Isn’t gold supposed to help when stocks fall?
Take two model portfolios: one holds stocks and gold; the other holds stocks and long-term U.S. government bonds.
On Tuesday, September 1, the stock-gold mix fell 1.58% from the previous close. The stock-bond mix lost 0.58%.
Imagine you added gold to your stocks because you wanted some protection when stocks fell. Now your mix is losing more than the stock-bond mix. “Wasn’t the gold supposed to help? Maybe I picked the wrong mix.” If you’re holding stocks and bonds instead, you might feel relieved: “At least I didn’t lose as much.” One day doesn’t tell you which portfolio is better. But it can make switching feel urgent.
That doubt is what we’re following this week. What makes it hard to stick with a choice when another one looks better? We’ll follow the same two portfolios through a recovery and another fall, and see how the urge to switch can fade and come back before you know how the week ends.
Tuesday, before the recovery
The stock-gold mix is called Stock-Gold 60/40. The stock-bond mix is Classic 60/40. By Tuesday’s close, the stock-gold mix was down 1.76% for the week so far; the stock-bond mix was down 0.93%. Both were losing money. One was losing less.
The two mixes invite different thoughts. With stocks and gold, it’s “Should I switch to the one that’s holding up better?” With stocks and bonds, it’s “Maybe this will keep cushioning the fall.” One loss makes you question your choice. The smaller loss makes it easier to trust yours, perhaps more than a single day deserves.
What we knew on Tuesday
Two reports came out at 10:00 a.m. ET on September 1, before that day’s close. But the daily returns start at the previous close, so they also include overnight moves and price changes before those reports arrived.
The Bureau of Labor Statistics’ July 2026 JOLTS report counted 7.3 million job openings, little changed. The Institute for Supply Management’s August 2026 manufacturing report showed slower growth: its PMI fell to 54.6 from 55.6 in July, but stayed above the 50 mark that separates expansion from contraction. Its prices index stayed at 71.1. Manufacturers were still paying higher input prices; the index itself hadn’t risen from July.
The news wasn’t a simple good-or-bad signal for these assets. A growing manufacturing sector can brighten the outlook for company profits. Rising input costs can squeeze those profits and change expectations for interest rates. If investors demand higher yields, long-term Treasury prices can fall, and investors may be willing to pay less for stocks.
Even when you’re counting on gold for protection, it faces a push and pull: inflation concerns can support demand, while higher yields make it more costly to hold an asset that pays no interest. These stock, bond, and gold channels are ways the news can matter, not proof of what moved the two portfolios that day.
What changed after Tuesday
Now look at the whole week, not just Friday’s result. The chart starts all five models from the same reference point, the August 28 close, and follows the next five trading days.
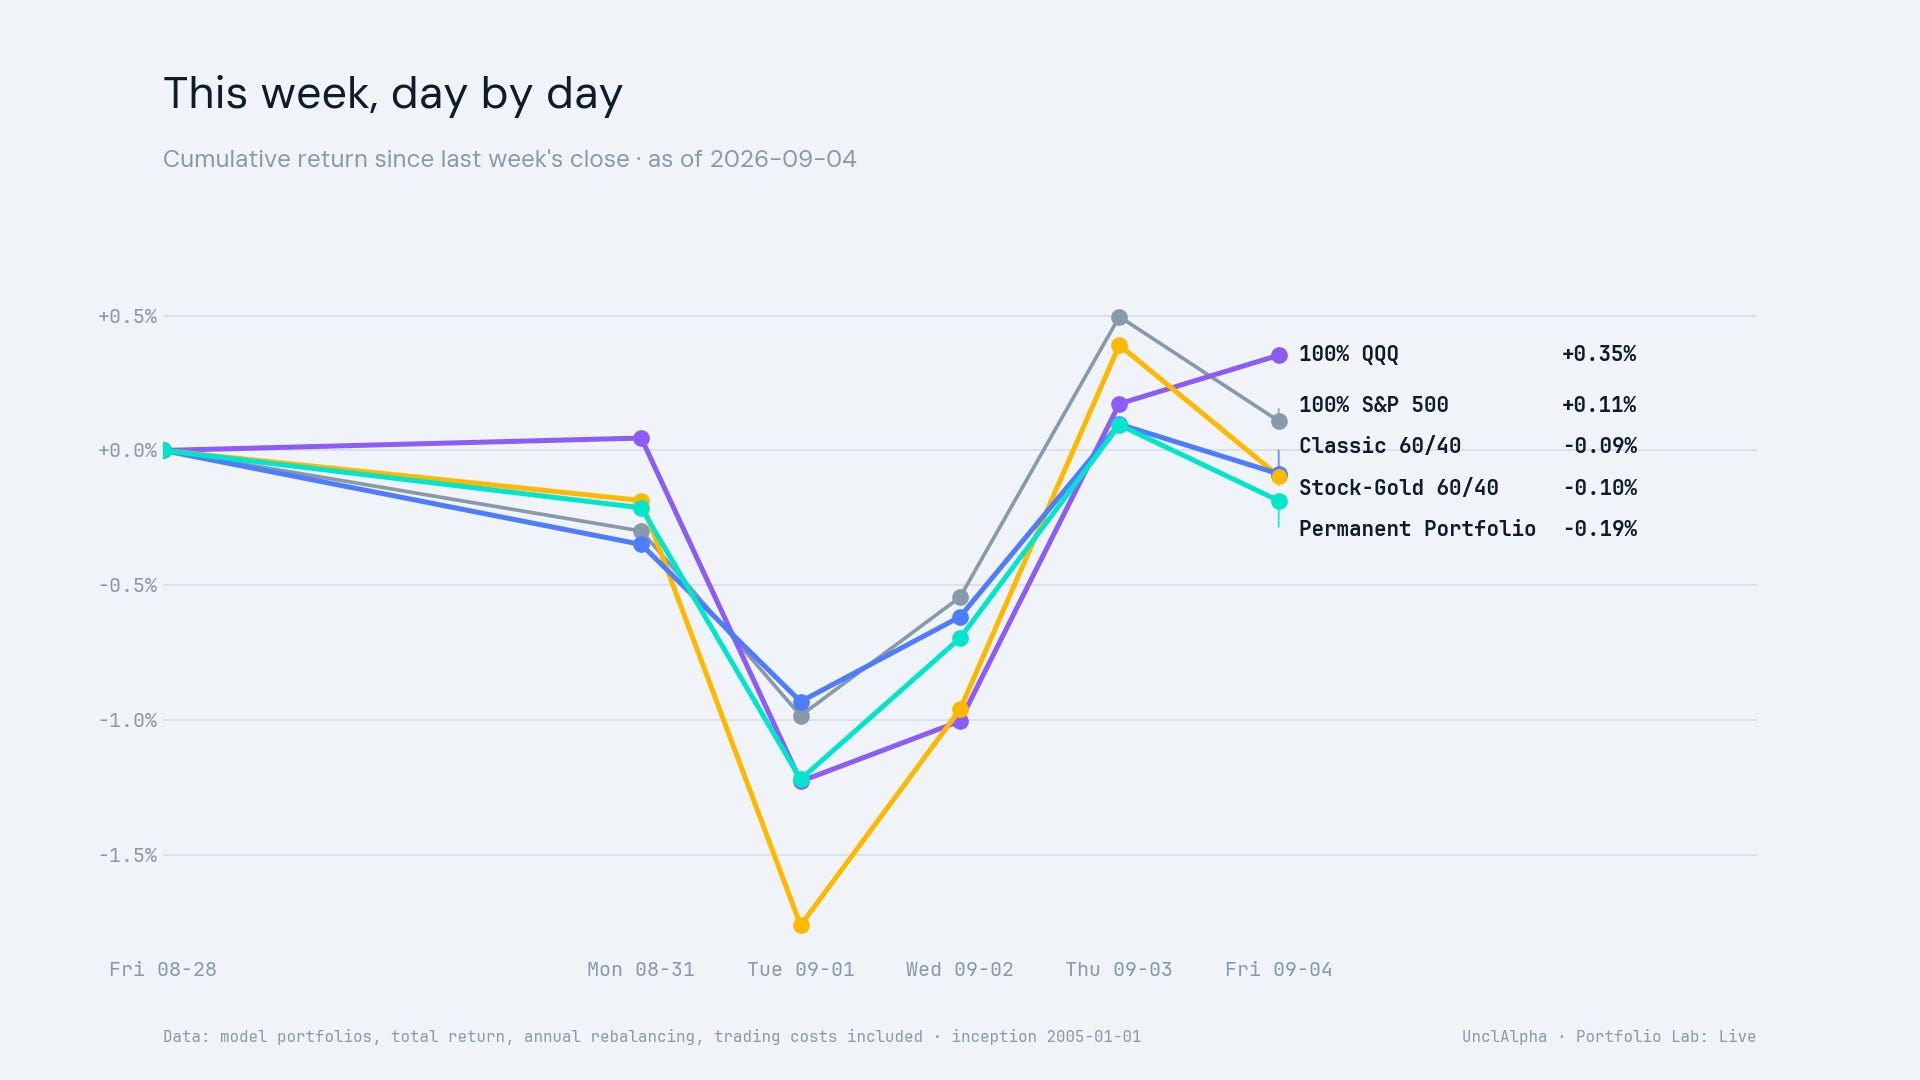
By Thursday’s close, both mixes had recovered their losses for the week. Stock-Gold 60/40 was up 0.39% from the previous Friday’s close; Classic 60/40 was up 0.10%. Then Friday’s fall put both back below that starting point. The final weekly numbers miss that stretch of recovery.
The daily table shows where those turns happened. Each return is measured from the previous recorded close, so you can see the two days of gains separately from Friday’s fall.
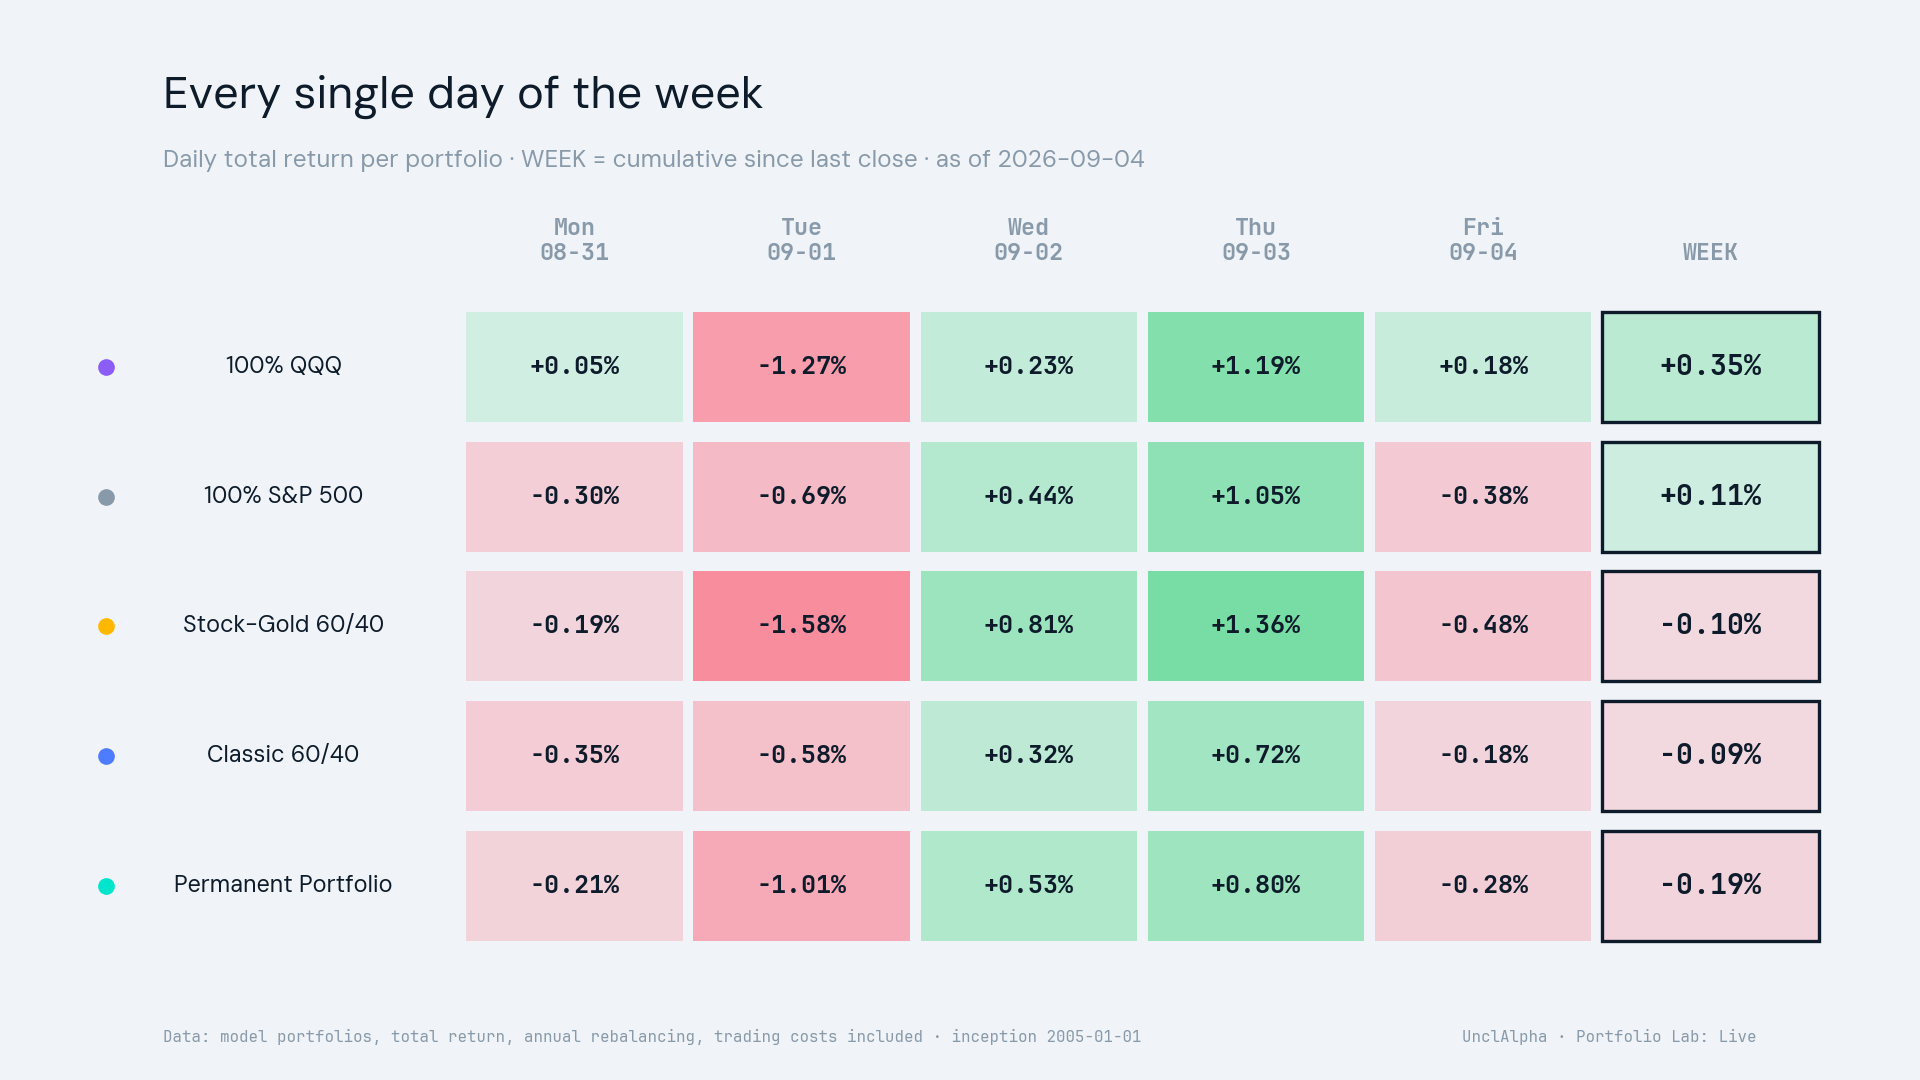
Both mixes rose on Wednesday and Thursday, then fell on Friday. Stock-Gold 60/40 lost 0.48% on Friday; Classic 60/40 lost 0.18%. It wasn’t one uninterrupted slide. There was a recovery in between.
As the stock-gold mix recovers, you can breathe a little easier: “Maybe I don’t need to switch after all.” Friday’s drop can bring the doubt back. In the stock-bond mix, the recovery can feel reassuring too, until another loss reminds you that losing less isn’t the same as being protected from losses. On Tuesday, you didn’t yet have Wednesday, Thursday, or Friday to look at.
The five models behind the scoreboard
UnclAlpha’s Portfolio Lab: Live follows five fixed model portfolios, not actual accounts. These are their target weights. Market moves can shift the weights between rebalances.
100% QQQ: QQQ only, bought and held.
100% S&P 500: SPY only, bought and held.
Stock-Gold 60/40: SPY 48 percent, QQQ 12 percent, GLD 40 percent.
Classic 60/40: SPY 60 percent, TLT 40 percent.
Harry Browne’s Permanent Portfolio: SPY, TLT, SHY, and GLD at 25 percent each.
The two mixes we’ve been following both aim to keep 60 percent in stocks. But the stocks aren’t the same: the stock-gold mix holds SPY and QQQ, while the stock-bond mix holds only SPY. So gold versus long-term Treasuries isn’t the only difference. This comparison can’t isolate how much of the return came from choosing gold instead of bonds.
Small weekly changes after an uneven path
The scoreboard puts the week’s result beside the longer record, using the same reporting periods for all five models. Calmar helps compare the annualized return with the biggest peak-to-trough loss along the way. It divides that return by the size of that loss over the same period.
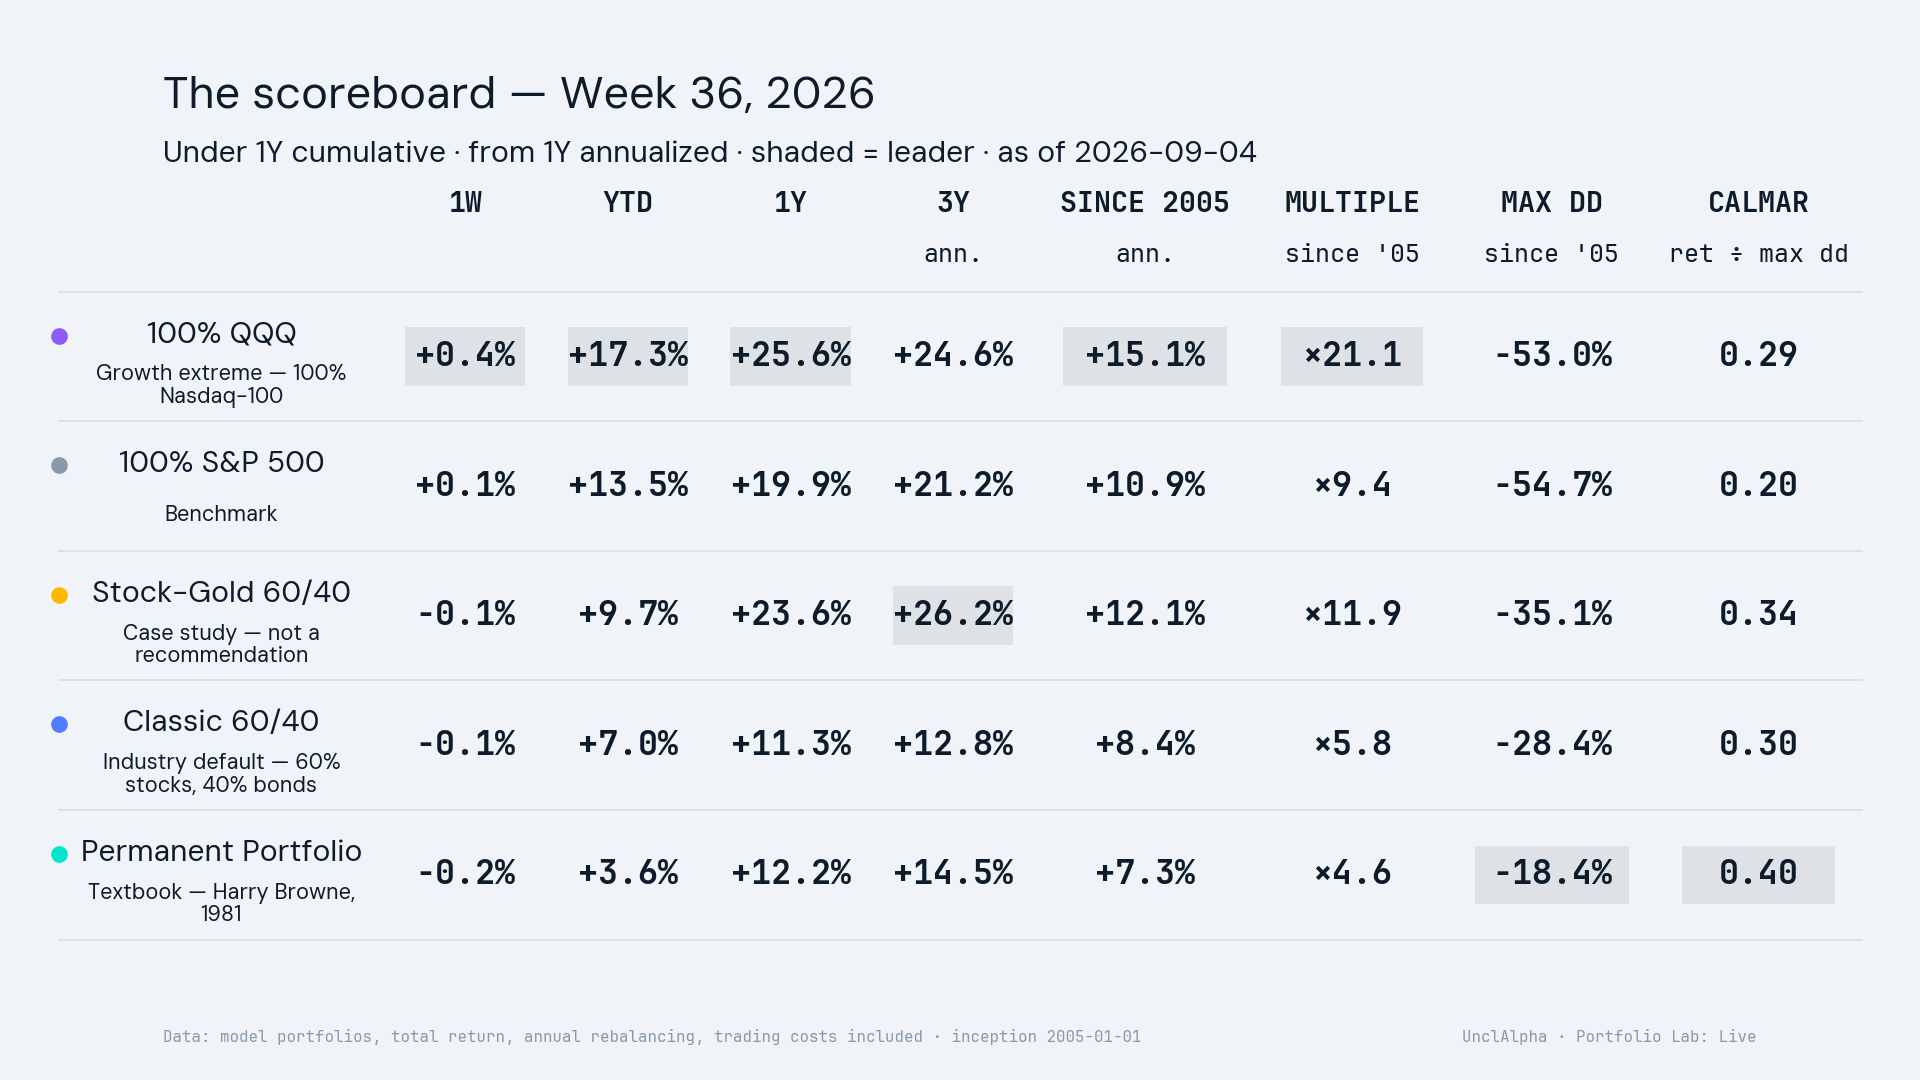
Weekly returns ranged from −0.19% for the Permanent Portfolio to +0.35% for QQQ. Stock-Gold 60/40 lost 0.10%; Classic 60/40 lost 0.09%. Their Calmar ratios over the full model history were 0.34 and 0.30, respectively. Those small weekly losses look very different from Tuesday’s larger losses.
Ahead over the year, down more on Tuesday
What happens when we look back a full year? This chart uses the same one-year period for all five models. It gives us a longer comparison, instead of asking one day to settle the question.
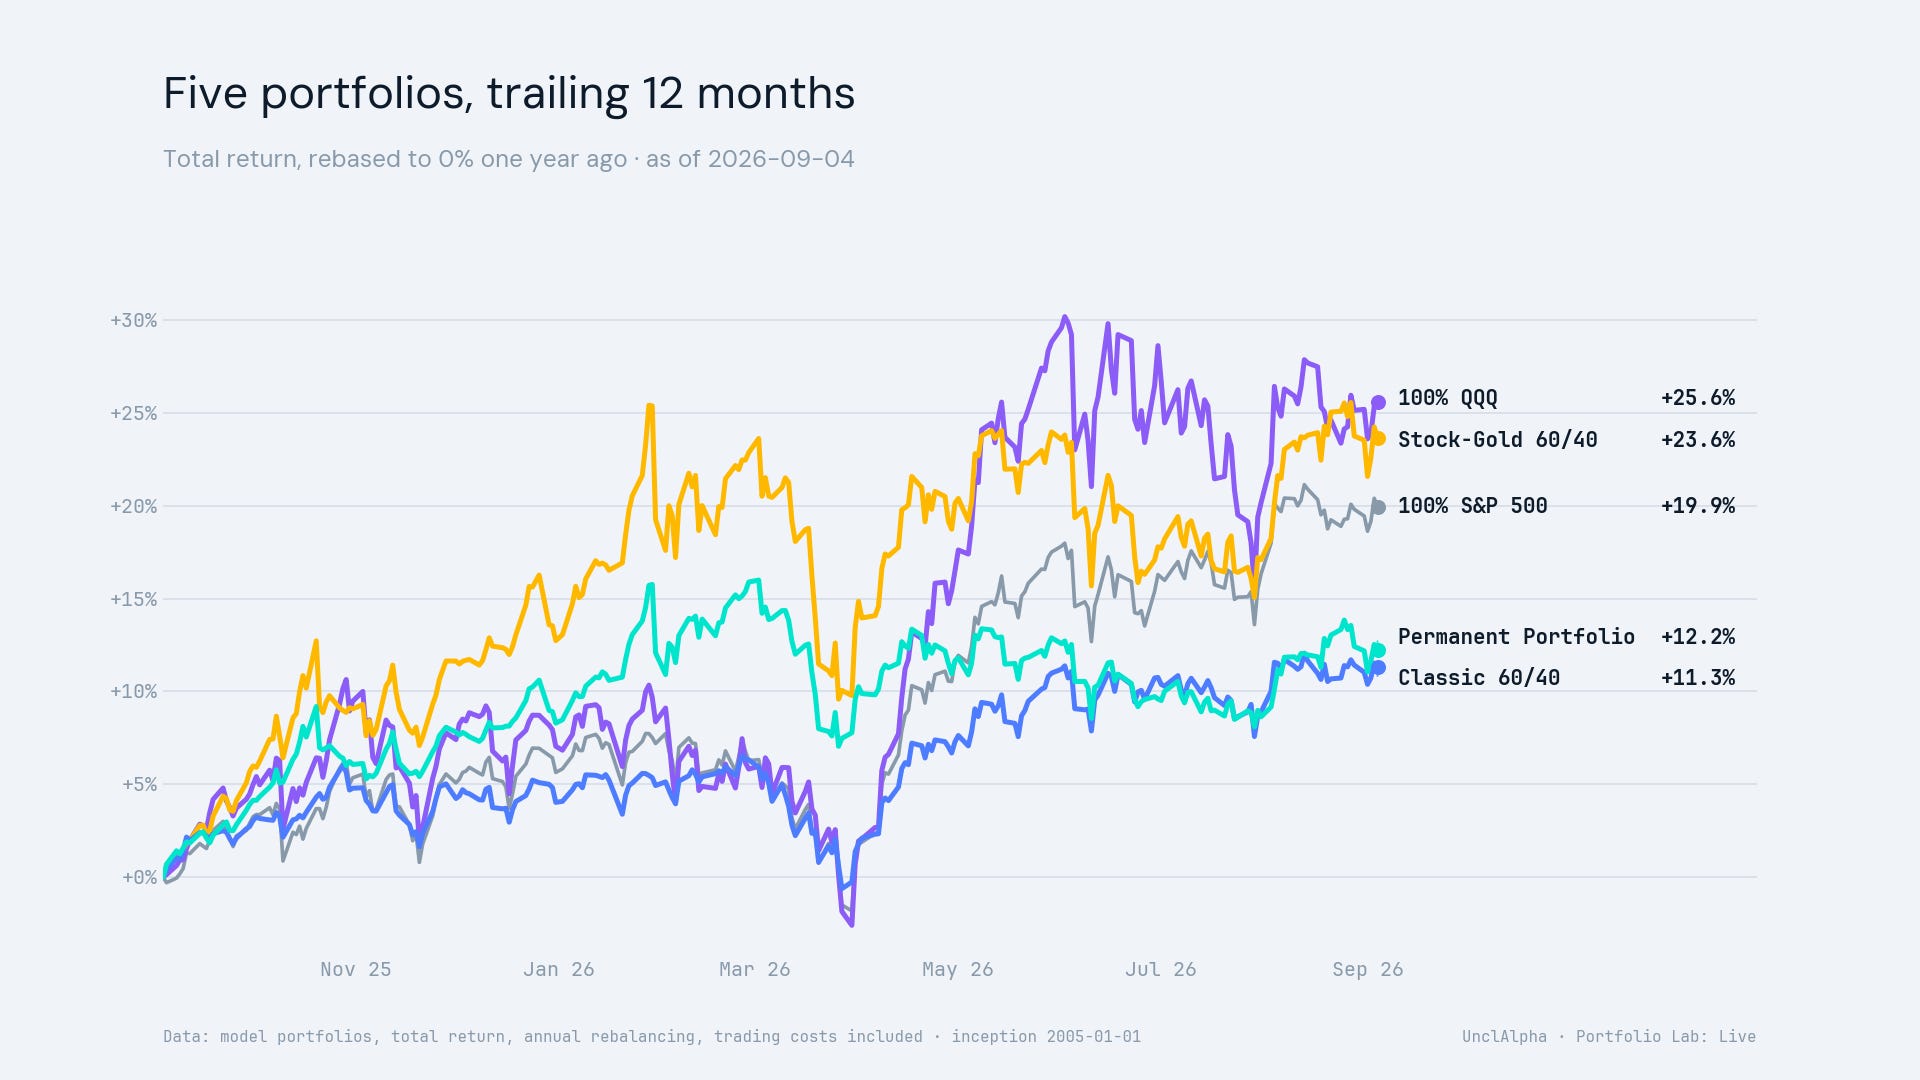
Over the year ending September 4, Stock-Gold 60/40 gained 23.63%, compared with 11.32% for Classic 60/40. The mix that did better over the year was also the one that lost more on Tuesday. Both facts belong in the story. Neither would have told you what would happen next.
What was difficult to hold
As the stock-gold mix recovers, the urge to switch can fade. You get some breathing room. When it falls again, the doubt can return. With the stock-bond mix, the recovery can build your confidence, until another loss reminds you that the cushion you felt wasn’t complete protection.
Put yourself back in Tuesday’s Stock-Gold 60/40 mix. Classic 60/40 wasn’t an abstract alternative. It was right there, losing less. That’s what could make you want to switch. If you’re holding Classic 60/40, you can take comfort in the smaller loss without knowing whether you’ve made the better choice. Friday’s result doesn’t tell you what Tuesday felt like. That’s why we keep the day-by-day record: it preserves the choice in front of you before you knew the ending.
Audit receipt
This week’s frozen model-data snapshot has this SHA-256 fingerprint: fbc3bcd30286dd44ed74e77c56b46c68a9f927403131f863a48bdca30d555613. It identifies the data used here, not actual trades.
The week ahead
For September 7-13, the BLS calendar lists two inflation reports: August producer prices (PPI) on Thursday, September 10, and August consumer prices (CPI) on Friday, September 11. Both are scheduled for 8:30 a.m. ET. We’ll watch the gold and Treasury holdings in Stock-Gold 60/40, Classic 60/40, and the Permanent Portfolio around those releases. These are dates to watch, not forecasts of which way prices will move or how much. At our September 6 research cutoff, neither the reports nor the market reactions were known.
Method and limits
Data cutoff: 2026-09-04. The models use daily closing prices adjusted for distributions, with those distributions reinvested. Each model starts with a hypothetical $10,000 on January 1, 2005; the first date with data for all five is January 3. Single-asset models buy and hold. Multi-asset models rebalance once a year, using the registered 0.1% drift threshold. Returns for periods shorter than a year are cumulative; the longer reporting periods use annualized returns. Maximum drawdown is the biggest peak-to-trough loss, not an annualized figure.
The $10,000 is a common starting amount, or normalization base. It doesn’t reset at the start of each day. A different starting amount scales the dollar values proportionally, by that amount divided by $10,000. Percentage returns, maximum-drawdown percentages, and Calmar ratios remain unchanged. The dates matter too: this record leaves out QQQ’s 2000-02 crash, but includes a strong period for gold and a severe bond bear market. Those choices limit what we can take from the results. The gold holding is GLD; a backtest using spot gold or gold futures isn’t directly interchangeable.
Portfolio Lab uses model portfolios for education, not actual holdings or personalized investment advice. The holding scenes let you imagine the experience; they aren’t accounts of observed investor behavior. Past performance doesn’t guarantee future results. Full disclaimer.