

The shared 2005 start was set by the five-portfolio comparison—not by QQQ. Here is what the result includes, and what it cannot show.
From January 3, 2005 through July 31, 2026, a hypothetical $10,000 in 100% QQQ grew to $202,130. It was the highest ending value among Portfolio Lab’s five model portfolios.
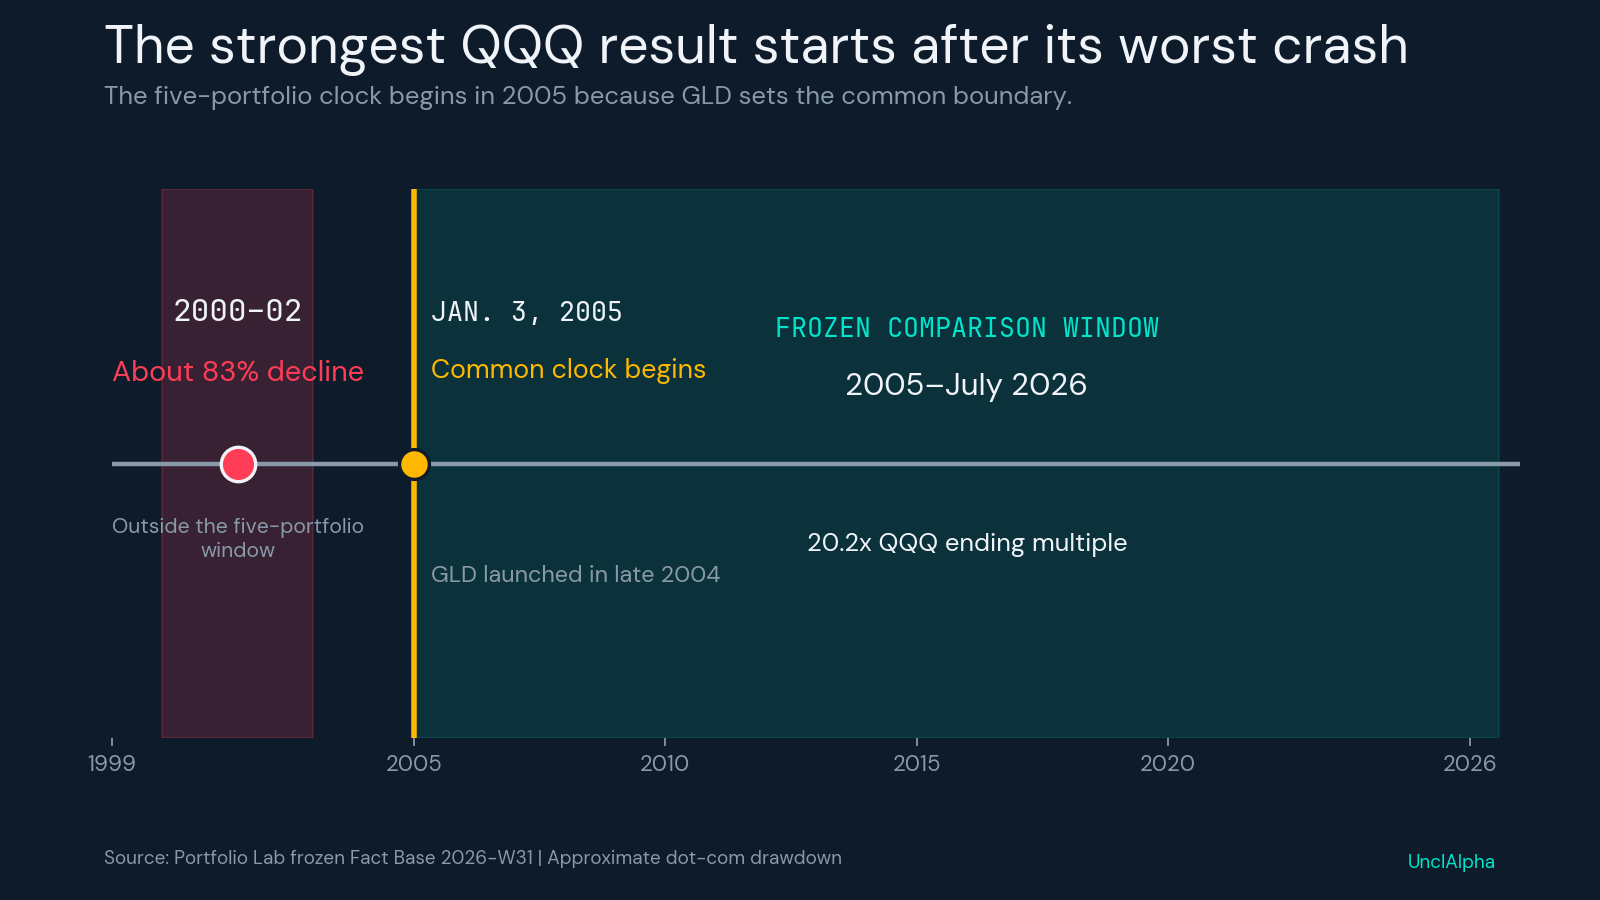
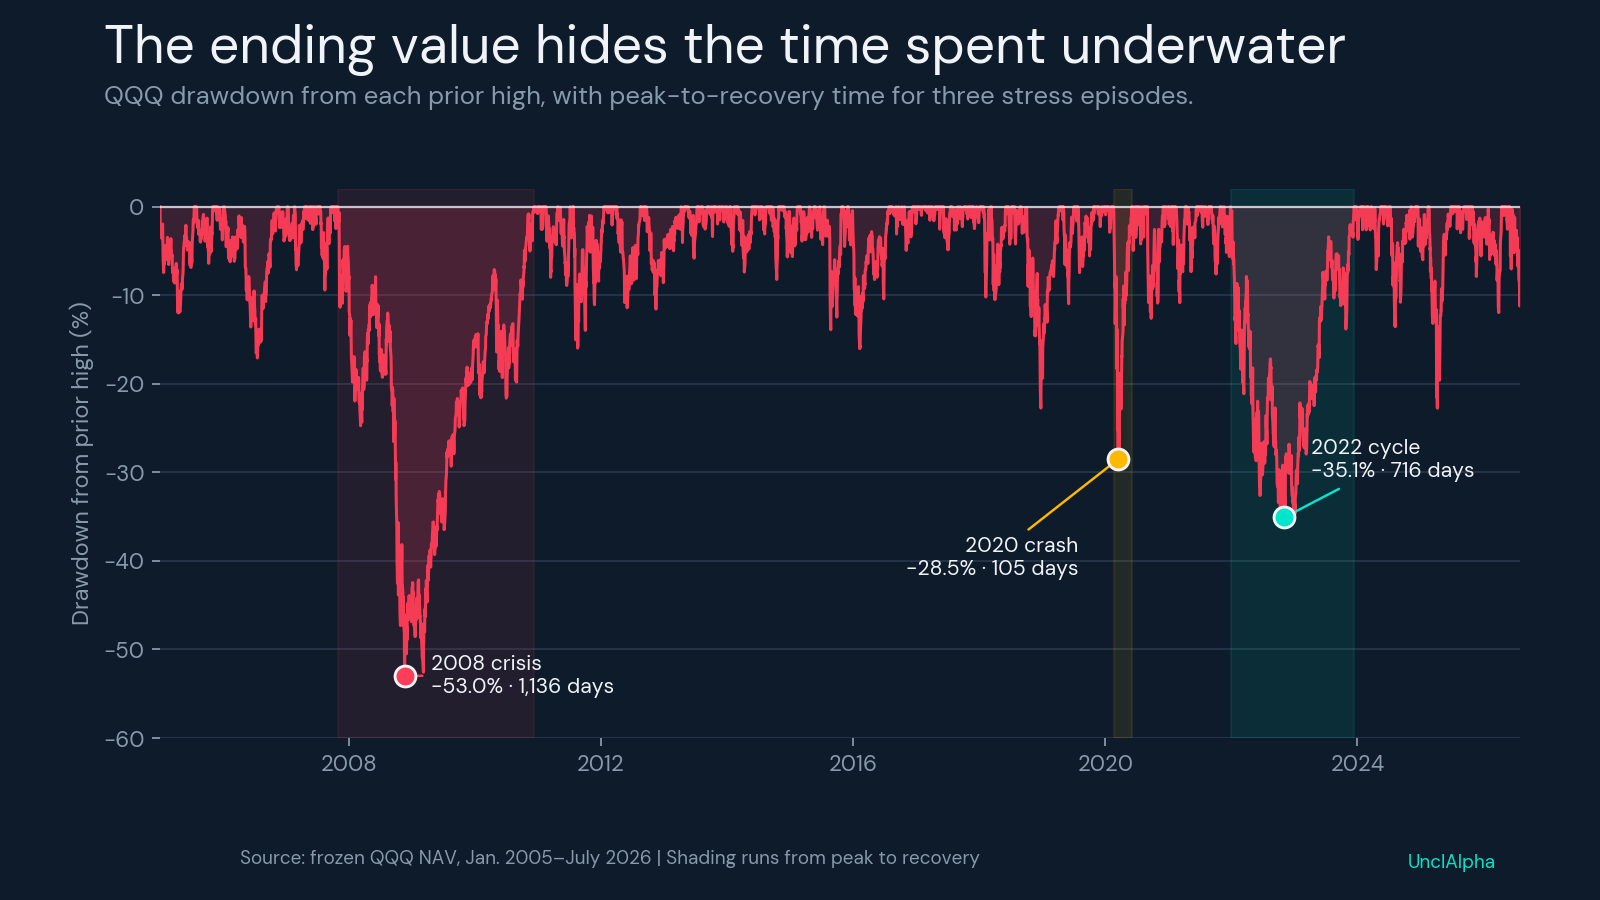
But the comparison starts after QQQ’s roughly 83% dot-com collapse in 2000-02. Even inside the later window, QQQ suffered a 53.0% maximum drawdown and once took 1,136 calendar days to recover its prior peak. The ending value is real within the model. It is not the whole record.
Historical model, not an account record or a recommendation. Data run through July 31, 2026; a future decline could be larger than any shown here.
Why the worst crash is missing
The start date was not chosen to flatter QQQ. It was chosen so all five Portfolio Lab portfolios could begin on the same clock.
GLD is the limiting asset. Because the gold ETF launched in late 2004, 2005 is the first year-start after every ETF used across the five portfolios existed. That makes the comparison consistent—and removes QQQ’s worst historical crash from view.
So this is a recovery-era sample, not QQQ’s complete history. It includes the global financial crisis, the COVID crash, the 2022 rate shock, and a long growth run. An earlier QQQ study beginning in 1999 includes the dot-com collapse, but its headline figures are not interchangeable with this five-portfolio comparison.
That distinction is the first lesson. A backtest window is not packaging. Change the start date and you can remove a crisis, raise an annualized return, or change a risk-adjusted ranking without changing the portfolio itself.
Method in plain English
“Frozen” means we stopped the clock on July 31, 2026 so the evidence will not move while you inspect it. Each line starts with $10,000. QQQ and SPY are held without rebalancing; distributions are reinvested. The three mixed-asset portfolios rebalance annually under the Lab’s fixed rule. Modeled trading costs are included; taxes, inflation, and investor cash flows are not. Full protocol: [METHOD_URL]
QQQ versus the broad-market benchmark
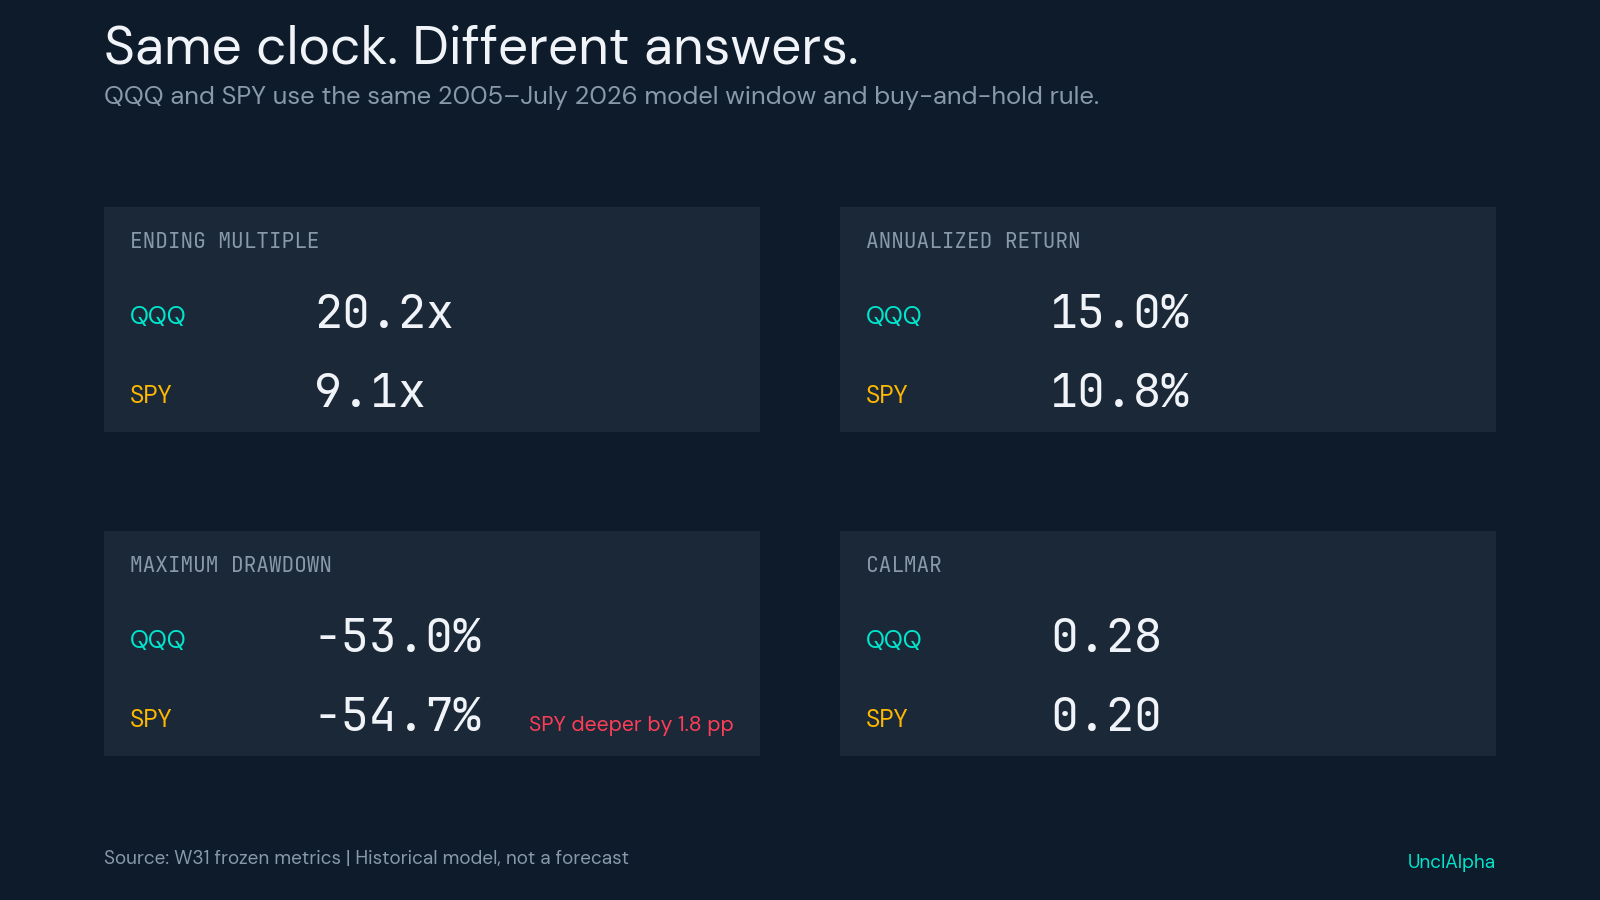
SPY gives the result a useful anchor. Both lines use the same dates, hypothetical starting value, reinvested distributions, cost model, and buy-and-hold rule.
100% QQQ: 20.2x ending multiple, 15.0% annualized return, -53.0% maximum drawdown, and 0.28 Calmar.
100% SPY: 9.1x ending multiple, 10.8% annualized return, -54.7% maximum drawdown, and 0.20 Calmar.
QQQ compounded faster in this window. The surprising line is maximum drawdown: SPY’s was slightly deeper. That does not establish that QQQ is safer. It shows why a selected sample can defeat a familiar intuition.
Calmar is simply annualized return divided by the absolute maximum drawdown. It places growth beside the deepest historical fall; it does not declare a universal winner.
The path asked more than one question
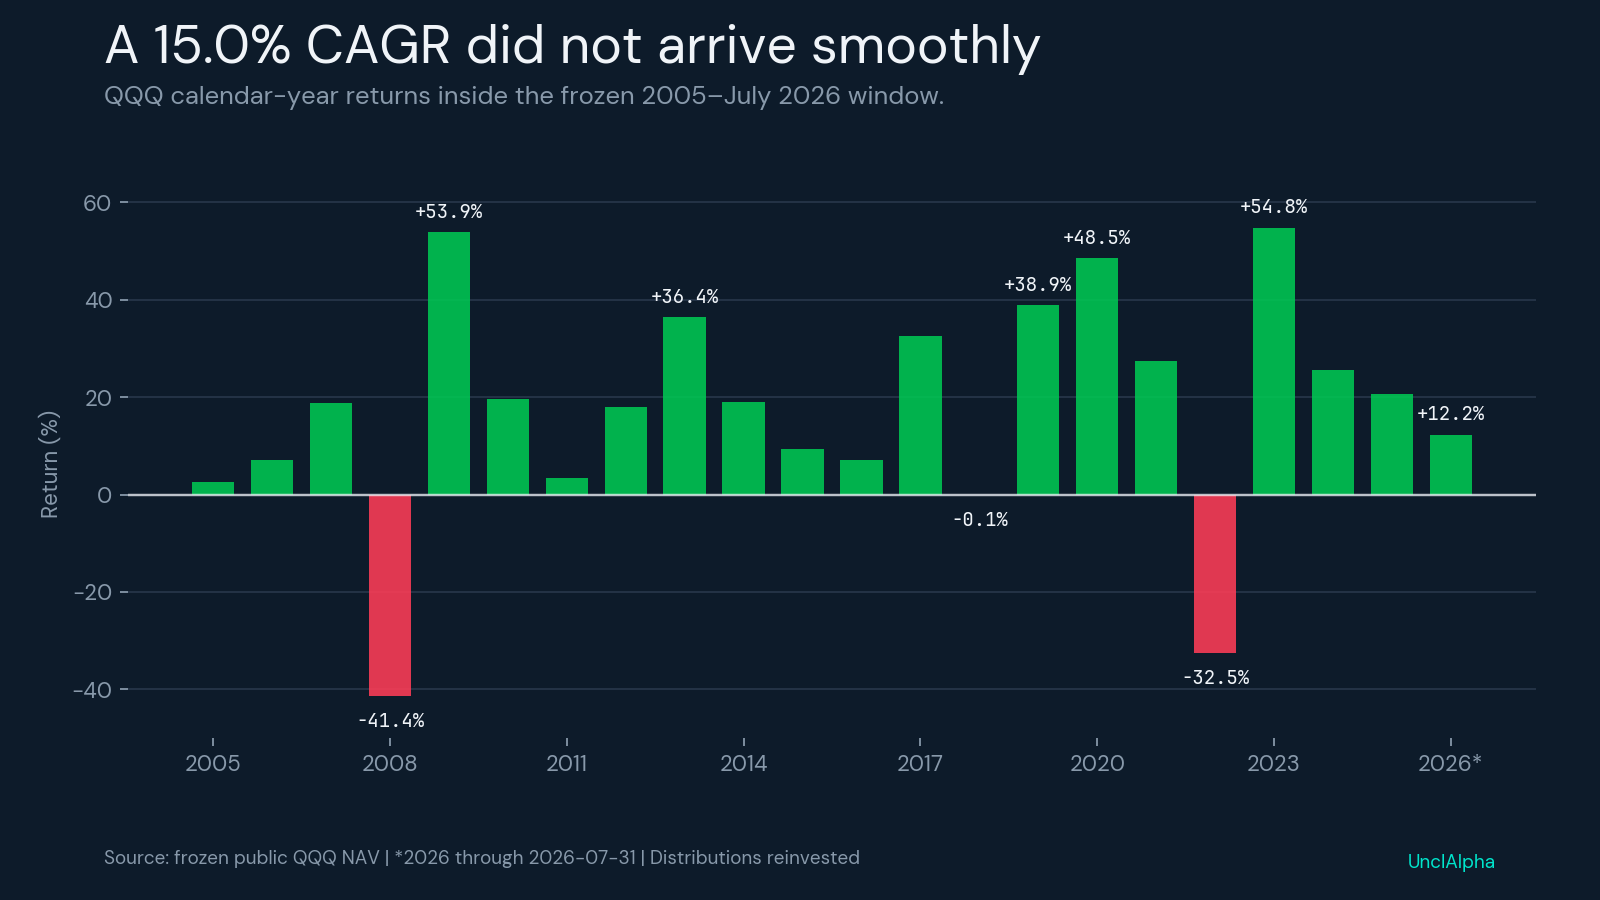
An endpoint cannot show when the pressure arrived or how long it lasted. Three declines in the same asset created three different holding problems:
2008 financial crisis. The model lost 51.1% in the fixed stress window, reached a 53.0% maximum drawdown, and did not recover its prior peak until December 10, 2010. The question in the moment: Could you stay with the rule after years below the old high?
2020 COVID crash. The model lost 27.9% in the fixed stress window, reached a 28.5% maximum drawdown, and recovered its prior peak by June 3, 2020. The question in the moment: Could you sit through a fast fall without knowing the recovery would also be fast?
2022 rate-hike cycle. The model lost 34.3% in the fixed stress window; the broader episode recovered on December 13, 2023. The question in the moment: Could you separate a difficult cycle from evidence that the rule had failed?
Those are holder scenarios, not survey results. At each low, the later recovery was still unknown.
Maximum drawdown measures the depth of the hole. Recovery time measures how long the old high stayed out of reach. QQQ’s longest episode in this record lasted 1,136 calendar days from peak to recovery. You had to live through both dimensions before the endpoint existed.
What QQQ contributes to the five-portfolio experiment
The five fixed lines are 100% QQQ, 100% S&P 500, Stock-Gold 60/40, Classic 60/40, and Harry Browne’s Permanent Portfolio. QQQ is the growth extreme. The other lines provide a broad-equity benchmark or exchange some equity exposure for gold and Treasury allocations.
The point is not to crown one permanent winner. It is to see what changes when the rule changes. In this particular window, QQQ delivered the highest ending value and annualized return. Other portfolios produced shallower declines or stronger return-to-drawdown ratios.
For QQQ, the conclusion is narrower and more useful than “it won.” The endpoint describes where this model finished. The 2005 start explains which history it excludes. The path shows what had to happen before the finish became visible.
Never read a backtest endpoint without its path and its window.
Download the frozen reference report:
https://drive.google.com/file/d/1cySbok-aTlWGl4WeKVbBPJXdH0F4m0I7/view?usp=drive_link
See the current five-line experiment in Portfolio Lab: Live.
UnclAlpha | Quant-trained. Simply explained.
For educational purposes only. Not investment advice, not actual holdings, and not a recommendation to buy, sell, or hold any security. Frozen model data run from January 2005 through July 31, 2026; adjusted-close distributions are reinvested and modeled trading costs are included. Historical performance does not guarantee future results. Full disclaimer: https://unclalpha.com/disclaimer