

Thursday closed with the kind of screen that can make discipline feel foolish: QQQ jumped 1.16%. The Permanent Portfolio barely moved. Inflation and labor news had arrived before the open. The price gap turned a quiet portfolio rule into an uncomfortable comparison.
That comparison raises three questions:
What does this gap mean for someone following the Permanent Portfolio?
Was the gap simply a macro story?
Did the Permanent Portfolio fail—or did Thursday expose the price of protection?
1. What does the gap mean? A holder looking at that screen asks the obvious question: “My Permanent Portfolio barely moved while QQQ jumped. Did I choose the wrong portfolio?” Thursday rewarded QQQ’s concentration and made diversification feel costly. For someone following the quieter rule, the temptation was to treat one sharp recovery as evidence that protection had become a mistake. For someone following QQQ, the pressure was different: protect the gain that had just returned.
2. Was the gap simply a macro story? The evidence supports a rate-pressure channel, but not a single-event explanation. July producer prices were unchanged at the headline level, initial unemployment claims increased, and contemporaneous reporting citing CME FedWatch recorded lower odds of a September rate increase than two days earlier. Lower rate pressure offered a friendlier channel for QQQ. The daily evidence cannot pin the gap on any single release. The third question stays open. Answering it means testing Thursday’s impression against construction, the longer record, and the full weekly path—and at Thursday’s close, none of that later path was available yet.
The fixed five-portfolio experiment
Start with construction. Portfolio Lab follows the same five portfolios under the same rules every week: 100% QQQ; 100% S&P 500; Stock-Gold 60/40; Classic 60/40; and Harry Browne’s Permanent Portfolio. QQQ is concentrated growth equity. The Permanent Portfolio divides capital equally among broad U.S. equities, long Treasuries, short Treasuries, and gold. Thursday displayed the difference between those designs; the next tests ask whether that difference amounts to failure.
The scoreboard
The first test uses the common history. The scoreboard compares return, maximum drawdown, and Calmar—the annualized return divided by the worst historical drawdown. A Calmar ratio of 1 would mean the annualized return matched the magnitude of that worst decline.
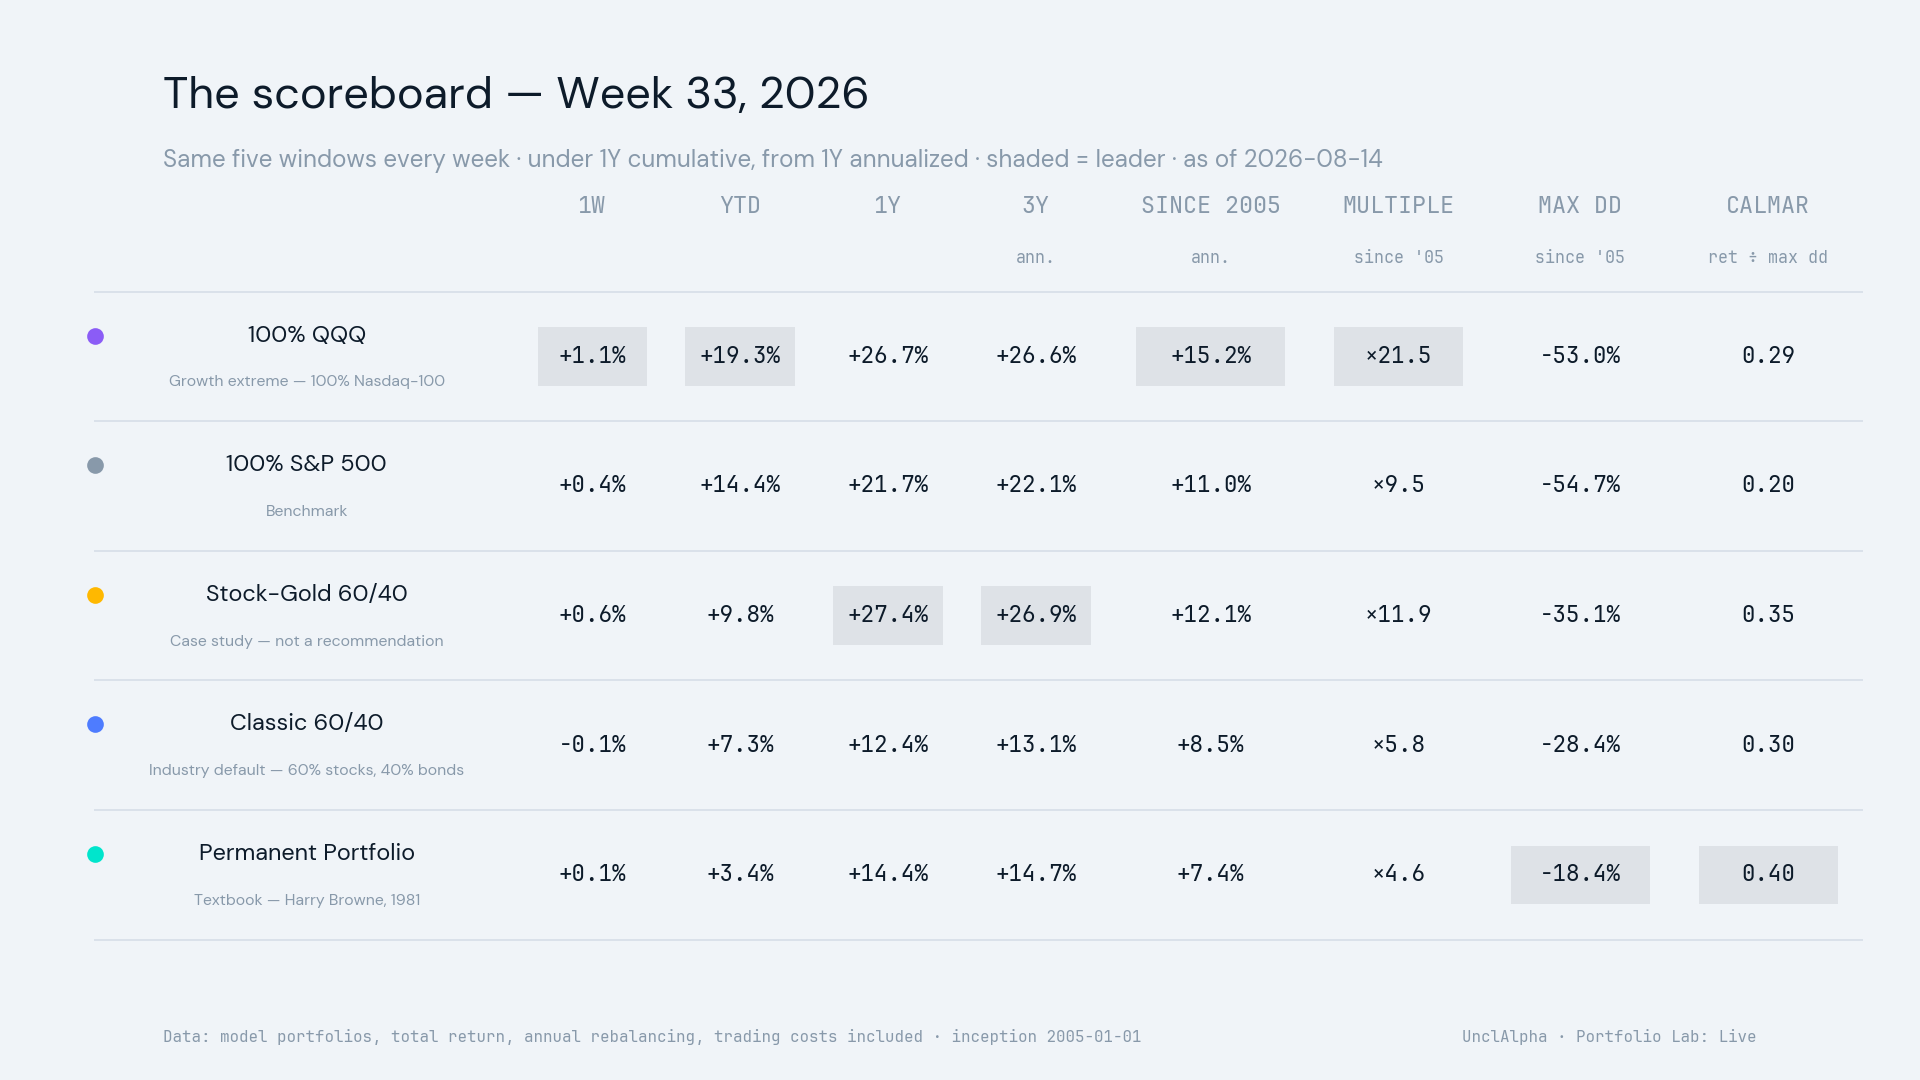
QQQ’s since-inception Calmar ratio was 0.29, compared with 0.40 for the Permanent Portfolio. Both were below 1: each portfolio’s annualized return was smaller than its worst peak-to-trough loss. QQQ accumulated more return in this history; the Permanent Portfolio paired its lower return with a shallower maximum drawdown.
The second test shortens the clock. Was the trade-off between growth and protection already visible over the same recent twelve months for all five portfolios? The chart shows the return paths on a common indexed basis. The numbers below add maximum drawdown from the same twelve months.
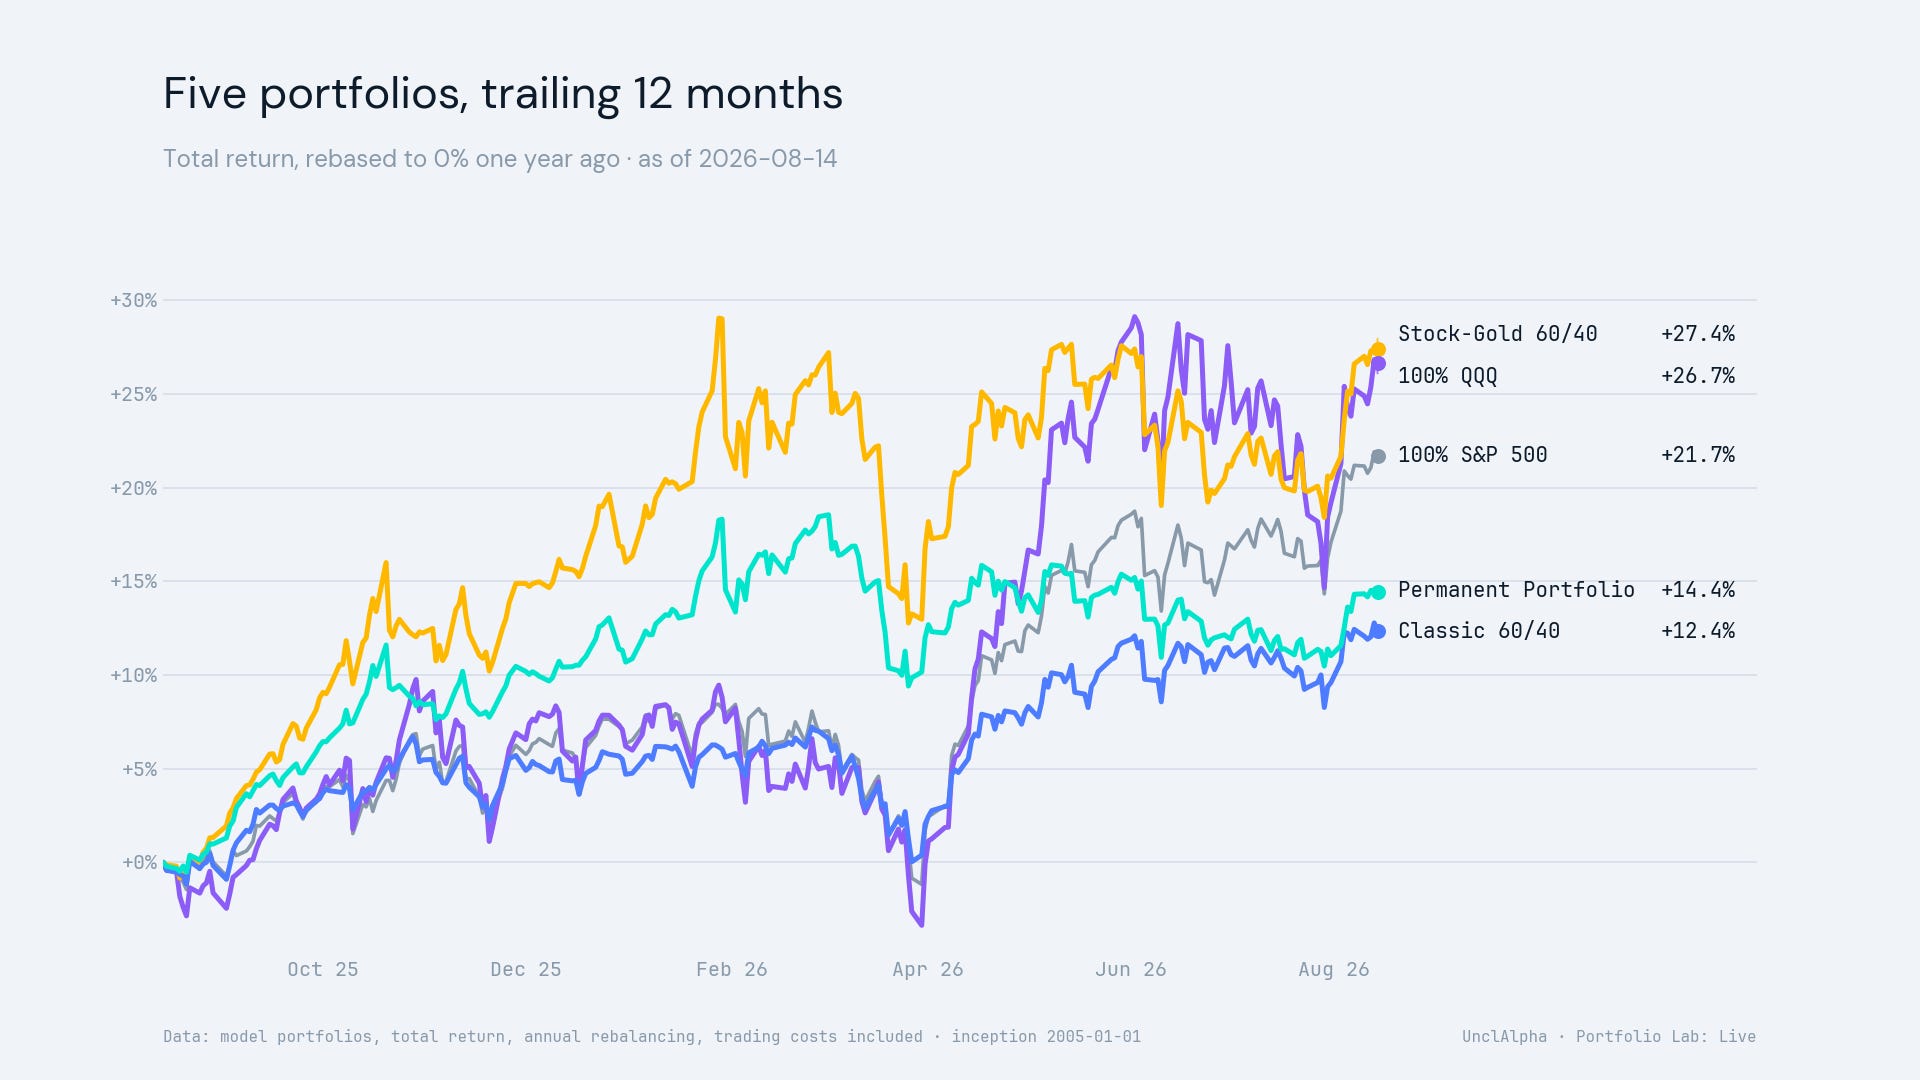
Over that year, QQQ returned 26.66%, versus 14.43% for the Permanent Portfolio. That return gap is only half the comparison. Over the same window, QQQ’s maximum drawdown was 11.96%, versus 7.71% for the Permanent Portfolio. Recent history had already made both sides of the trade-off visible: the more concentrated portfolio delivered the larger gain and the deeper drawdown. Thursday compressed the return side of that longer contrast into a single, emotionally sharper close.
The week under the microscope
The third test restores the sequence that weekly totals hide. Resetting every portfolio to the same prior-Friday baseline shows when the two experiences separated before the week had finished.
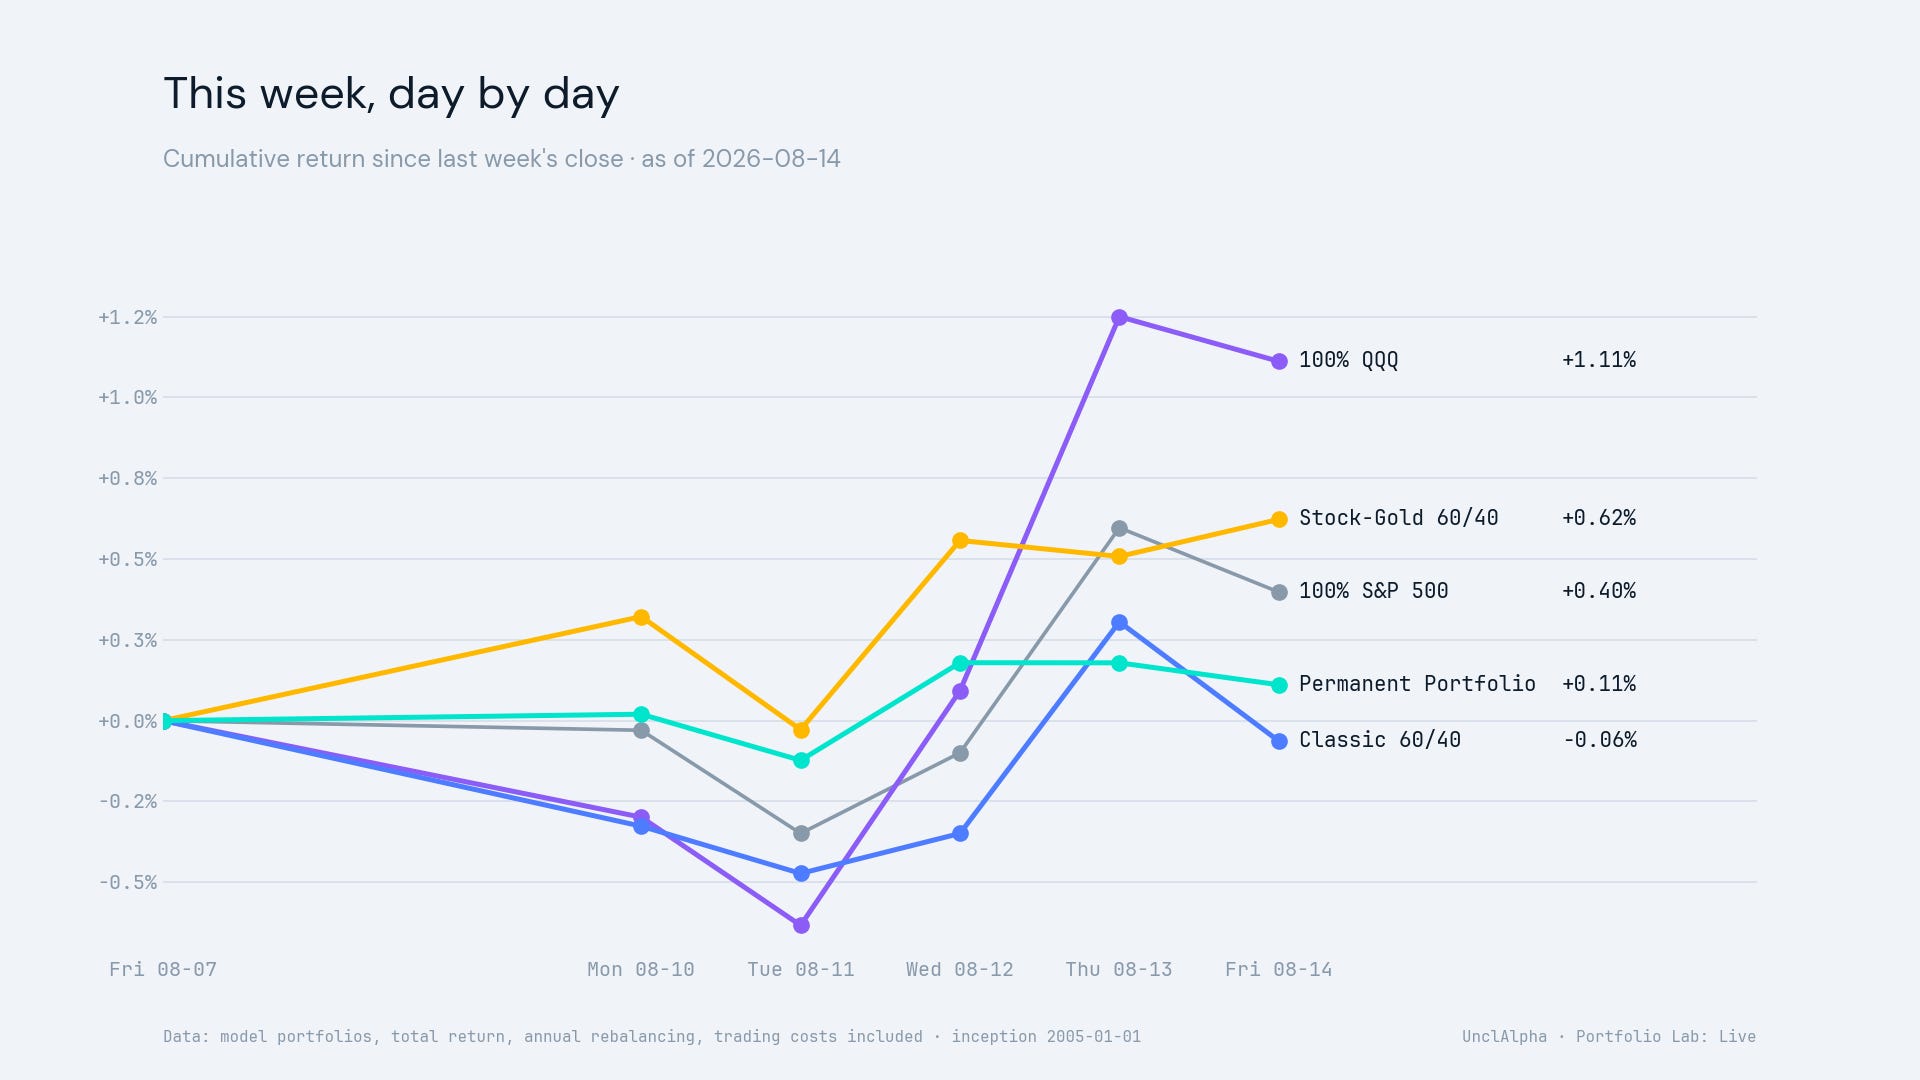
The separation arrived on August 13. QQQ gained 1.16% and completed a 1.89% recovery from its August 11 trough. The Permanent Portfolio was essentially flat. That was the moment last week’s comfort acquired a visible cost.
The daily table completes that test: which portfolio rose or fell on each close, and what happened after Thursday’s temptation appeared?
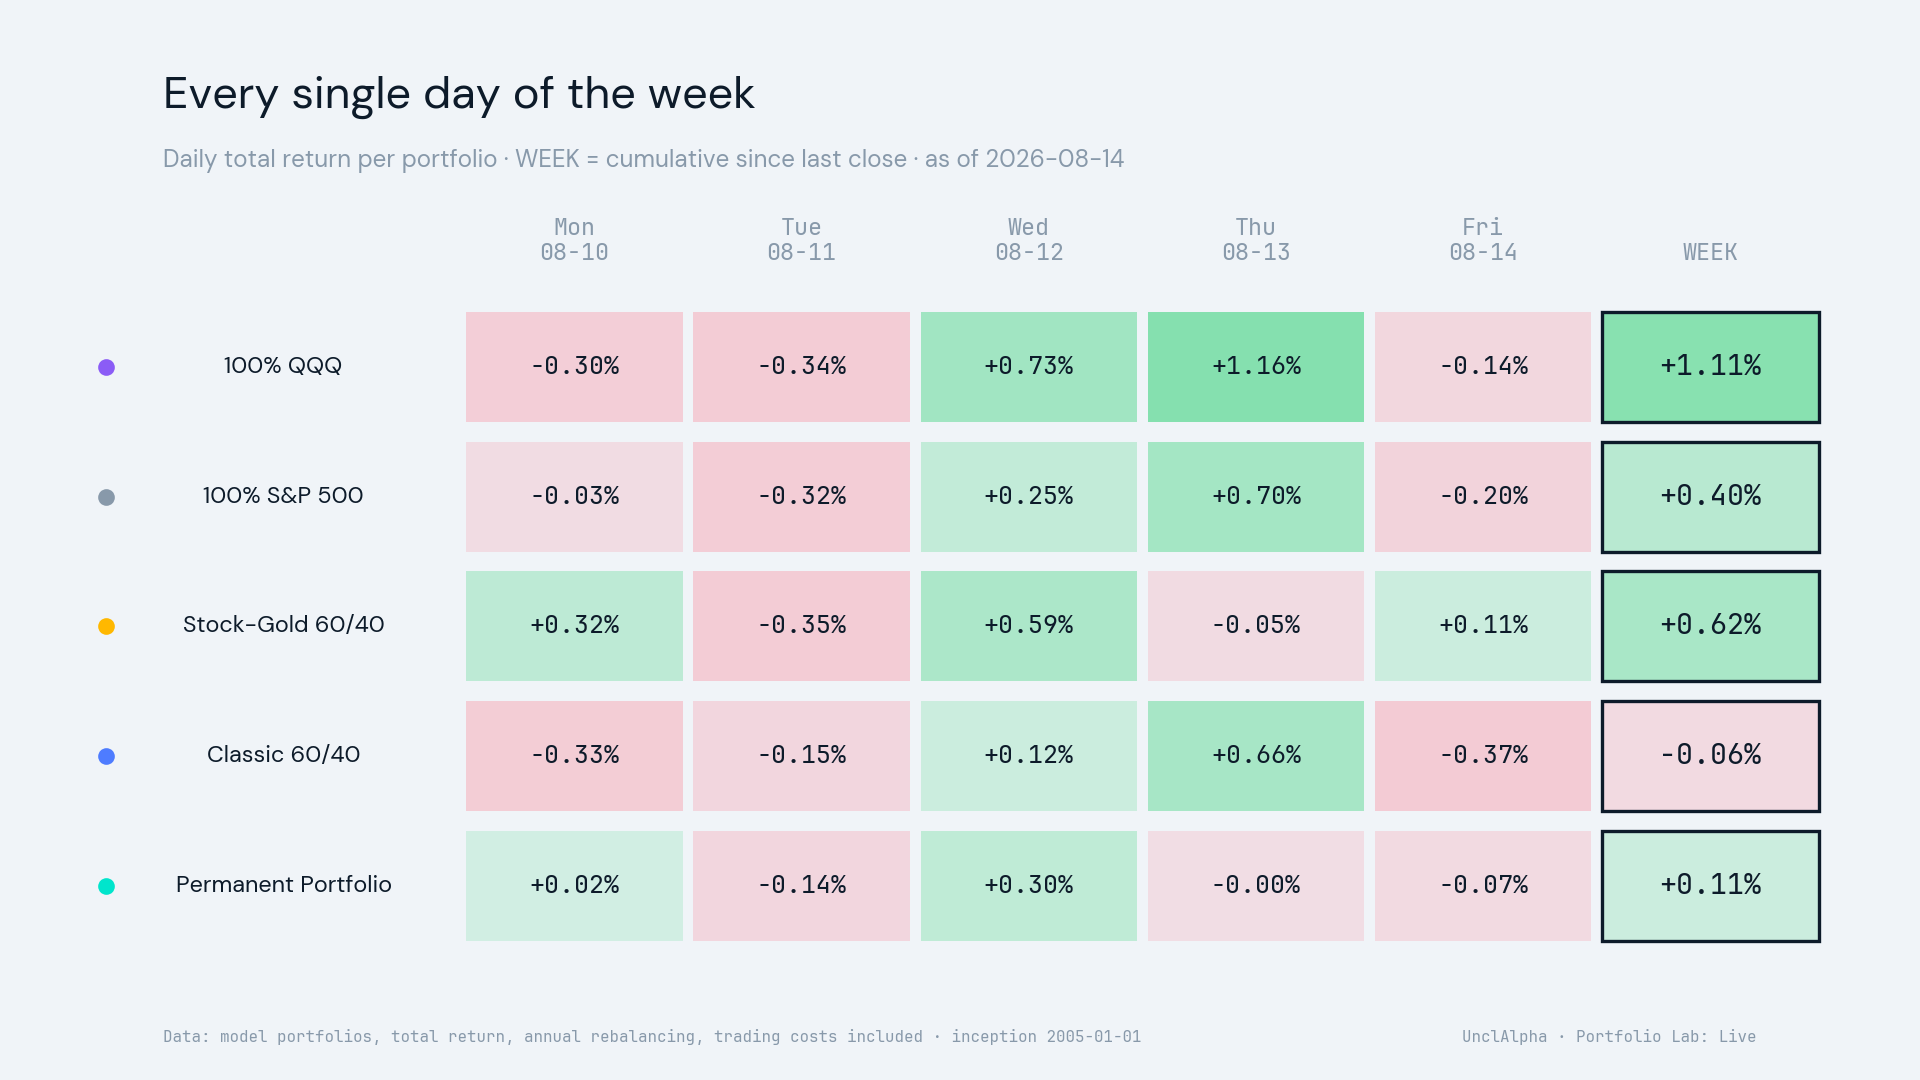
QQQ finished the week up 1.11%. The Permanent Portfolio finished up 0.11%. The weekly gap remained, but neither endpoint alone shows what each rule asked its follower to endure on the way there.
Friday trimmed both weekly gains, but one later close could not decide whether protection had failed. A Permanent Portfolio follower could still question the muted recovery; a QQQ follower could now feel pressure to protect Thursday’s rebound. The later close changed the pressure, but it did not make Thursday’s choice obvious in advance.
This week’s lesson
Diversification changes the shape of disappointment. During weakness, a buffer can make a concentrated decline easier to bear. During a sharp rebound, that same buffer can look like dead weight. The rule stays still while the emotional bill changes with the path.
Closing answer
So, did the Permanent Portfolio fail? No. What happened was narrower: its multi-asset buffer lagged while QQQ’s concentrated growth exposure rebounded. The value of repeating the same fixed experiment each week is seeing the cost of protection change while the rules stay still. That is why last week’s comforting buffer could become this week’s source of regret.
Audit receipt
For readers who want to verify that this issue uses the frozen weekly dataset, its public audit hash is
89156de9bfa2a577e441d573cea641e3ff9266b44b01270c1f4ac3361e1e4347.
The week ahead: what to watch
The next observation points are already scheduled:
August 18, 8:30 a.m. ET — July U.S. import and export price indexes (BLS calendar).
August 19, 2:00 p.m. ET — minutes of the July 28–29 FOMC meeting (Federal Reserve calendar).
August 20, 10:00 a.m. ET — Deere’s fiscal third-quarter earnings call (Deere Investor Relations).
Portfolio Lab will add the resulting portfolio paths only after those observations exist.
Method and limits
Data run through 2026-08-14. Each historical model begins with a hypothetical $10,000 on 2005-01-01, with the first common observation on 2005-01-03. Within this model, a different starting amount simply scales every dollar value proportionally. Multiply each dollar value by your chosen starting amount divided by $10,000; percentage returns, maximum-drawdown percentages, and Calmar ratios remain unchanged. Returns use daily adjusted closes with distributions reinvested. Single-asset portfolios are buy and hold; multi-asset portfolios rebalance annually under a 0.1% drift threshold. Returns under one year are cumulative, while longer periods are annualized. The common history excludes QQQ’s 2000–02 crash, includes a strong gold cycle and a severe bond bear market, and uses GLD rather than spot gold or gold futures.
Portfolio Lab is educational model tracking with no actual holdings, and it is not personalized investment advice. Historical and hypothetical results do not promise safety or future returns. Full disclosure: https://unclalpha.com/disclaimer.