

Timing note: This Week 32 review was planned for the weekend but arrives Monday, August 10; “this week” below means the five trading days through Friday, August 7.
Wednesday delivered the kind of macro news that refuses a clean bullish-or-bearish label. The July ISM Services report showed stronger activity, contracting employment, and higher input prices. Stronger activity could favor equities; hotter costs could pressure long Treasuries and rate-sensitive growth stocks. By the close, however, QQQ—our concentrated Nasdaq-growth line—was down 0.90%, while the Permanent Portfolio—split equally among U.S. stocks, long Treasuries, short Treasuries, and gold—was up 0.96%. The news made both portfolios worth watching; it does not establish why either daily return occurred.
That is when the dangerous, familiar thought appears: “My QQQ just fell while the Permanent Portfolio rose. Did I choose the wrong portfolio?” One close cannot answer that. A hypothetical QQQ holder was watching part of a still-positive week disappear. A hypothetical Permanent Portfolio holder was watching diversification provide a one-day buffer. The contrast was real; superiority was not established, and Thursday was still unknowable.
The useful question is what happened to each temptation when the next close arrived—and what the full record says once we separate one emotional session from the rule each portfolio was built to follow.
Thursday made the QQQ holder’s urge to protect the remaining gain harder to dismiss: another lower close could make switching toward the portfolio that had looked safer feel prudent. The Permanent Portfolio holder then faced the mirror-image pressure. Its own lower close could turn Wednesday’s relief into doubt that the buffer had been overread. Neither reaction would be irrational. Neither Thursday outcome was available on Wednesday, so hindsight cannot turn the earlier choice into an obvious mistake.
This week’s lesson
Portfolio construction does not remove discomfort; it changes its sequence. Concentration can make an early gain feel fragile. Diversification can provide relief and then disappoint when the cushion does not repeat on command. Before treating one convenient close as a verdict, separate two questions: Did the portfolio’s rule change, or did only the latest path—and your reaction to it—change?
The fixed five-line experiment
Portfolio Lab keeps the same five educational model lines: 100% QQQ, buy-and-hold growth equity; 100% S&P 500, the broad-equity benchmark; Stock-Gold 60/40, combining SPY, QQQ, and gold; Classic 60/40, combining SPY and long Treasuries; and Harry Browne’s Permanent Portfolio, combining SPY, long Treasuries, short Treasuries, and gold in equal sleeves. Fixing the rules lets us study different paths without redesigning a portfolio after seeing the result.
The scoreboard
The scoreboard asks a broader question than “Who is ahead?” Across the same registered windows, how much annualized return came with how much maximum drawdown? Calmar—annualized return divided by absolute maximum drawdown—puts those two quantities on one line, but it is a comparison lens, not a universal verdict.
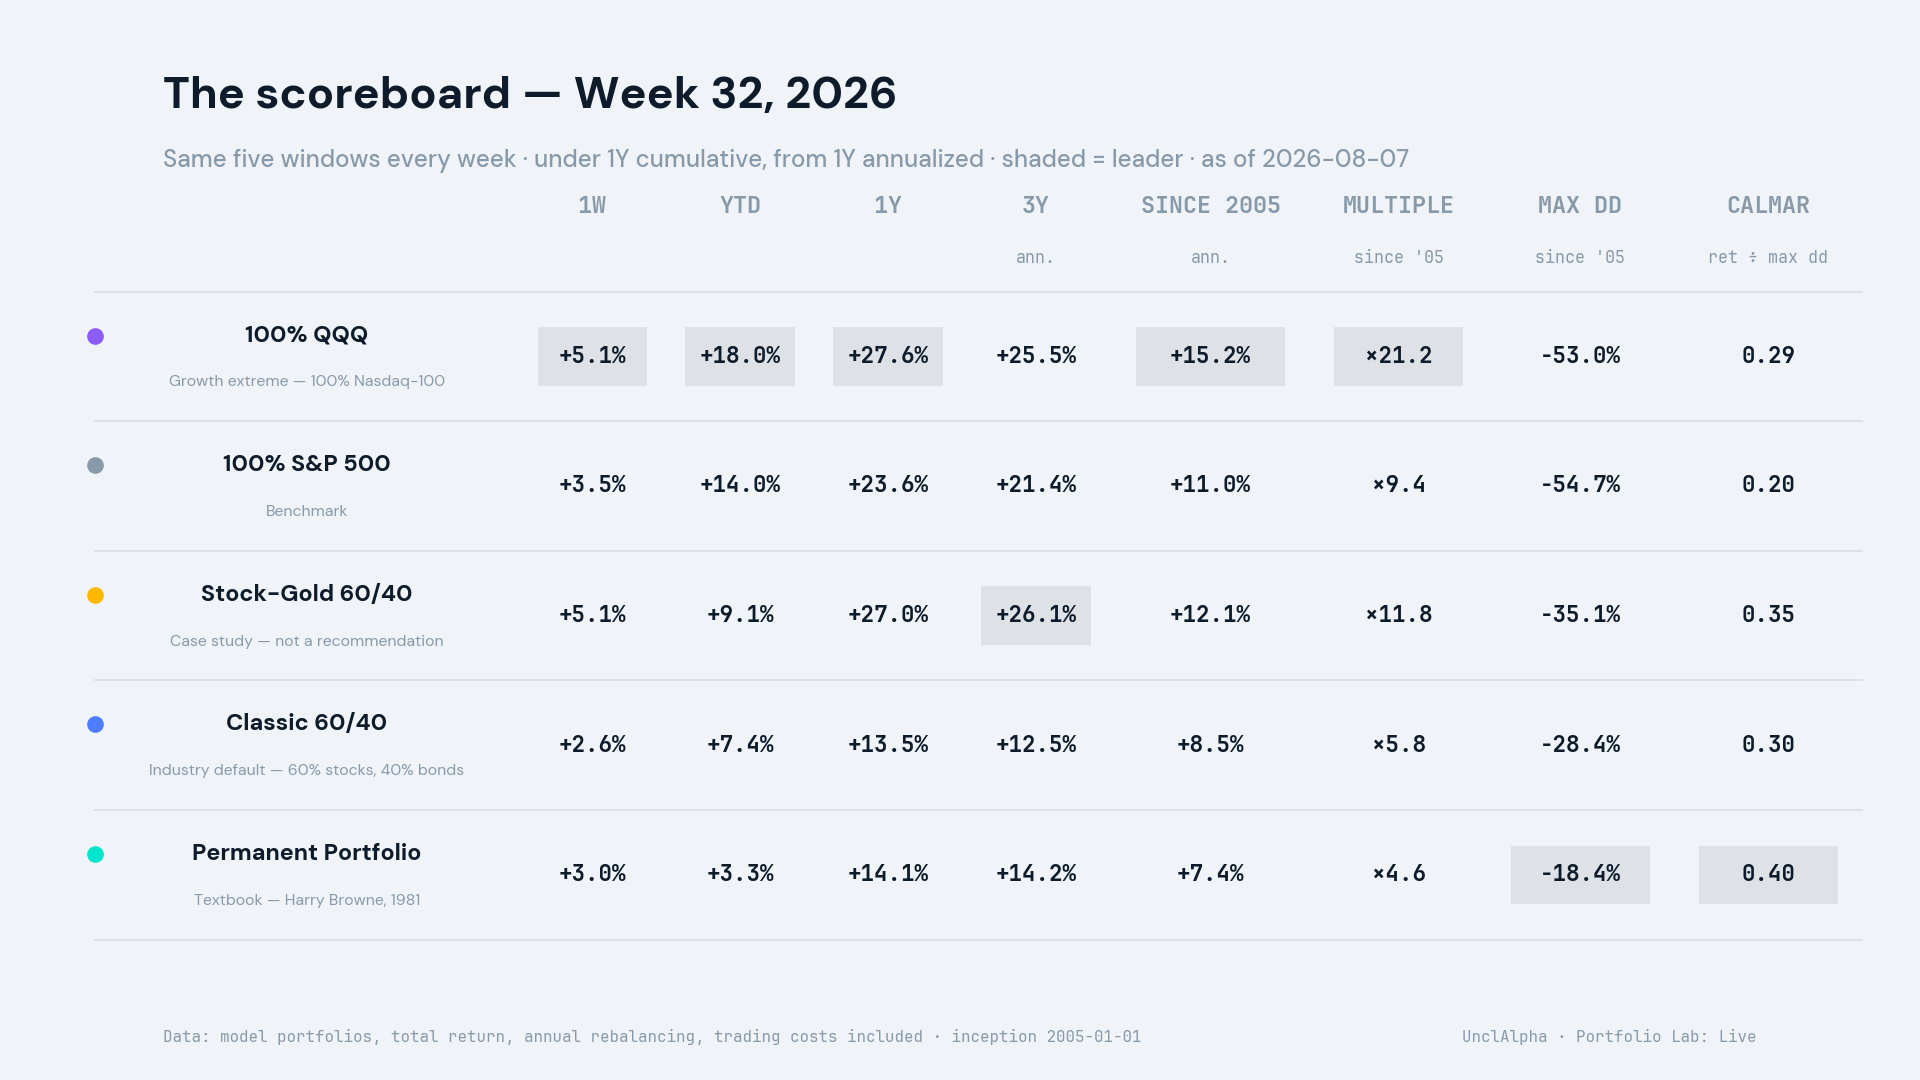
Since the common 2005 start, QQQ shows the stronger annualized return of the pair at 15.20%, but also the deeper maximum drawdown at −52.96%, producing a Calmar of 0.29. The Permanent Portfolio shows 7.36% annualized with an −18.38% maximum drawdown and a 0.40 Calmar. That does not make either portfolio “better.” It makes the trade-off visible: more historical growth arrived with a much harsher historical fall.
The trailing-one-year chart narrows the clock. It compares all five models over the same recent window, with distributions reinvested and without annualizing a period shorter than one year. This view answers what happened recently, not what should happen next.
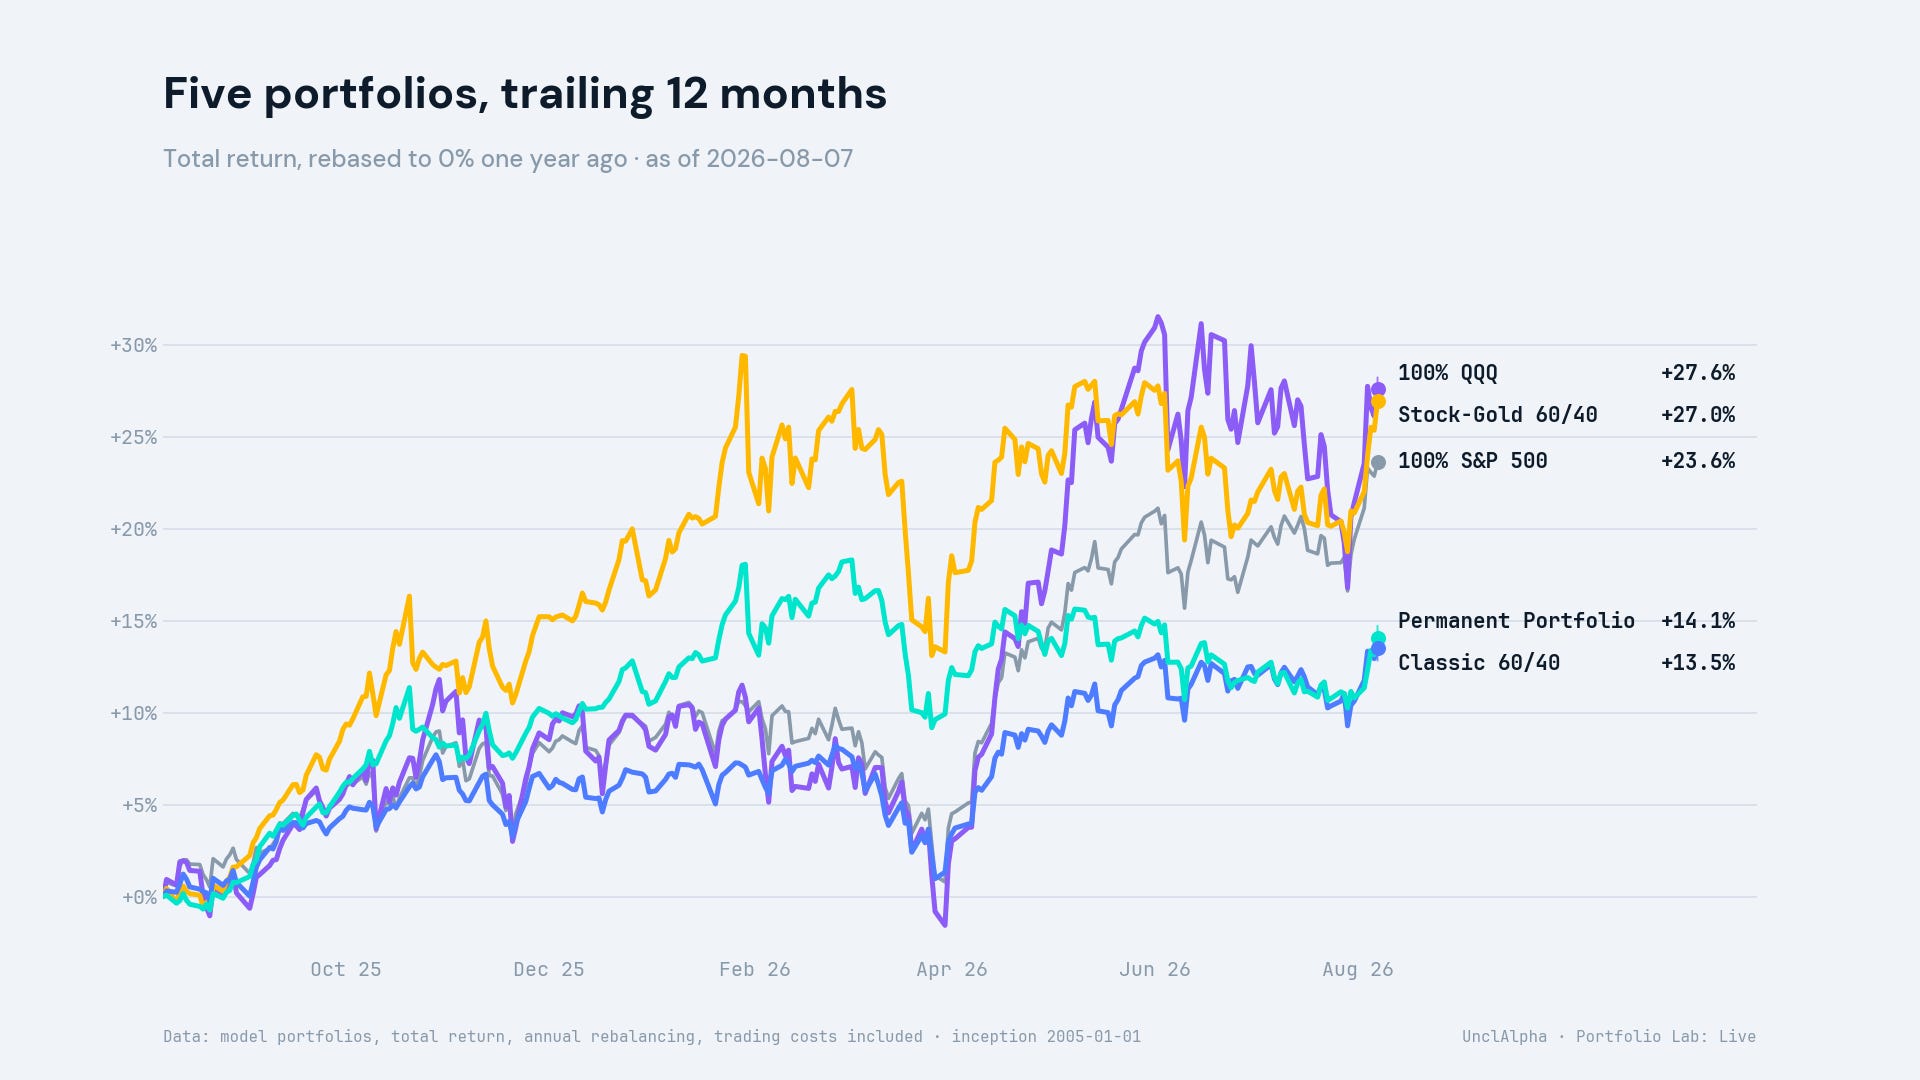
Over that common trailing year, QQQ led at 27.61%, followed closely by Stock-Gold 60/40 at 26.97%. The S&P 500 returned 23.62%, the Permanent Portfolio 14.08%, and Classic 60/40 13.50%. The ordering explains why a QQQ holder could still have the stronger recent result while feeling more pressure on Wednesday. It does not turn the ranking into a forecast.
The week under the microscope
Weekly totals hide the order in which gains and setbacks arrived. Rebased to the prior Friday close, the weekly path asks when the temptation to protect, switch, or declare victory actually appeared—not merely where the two lines finished.
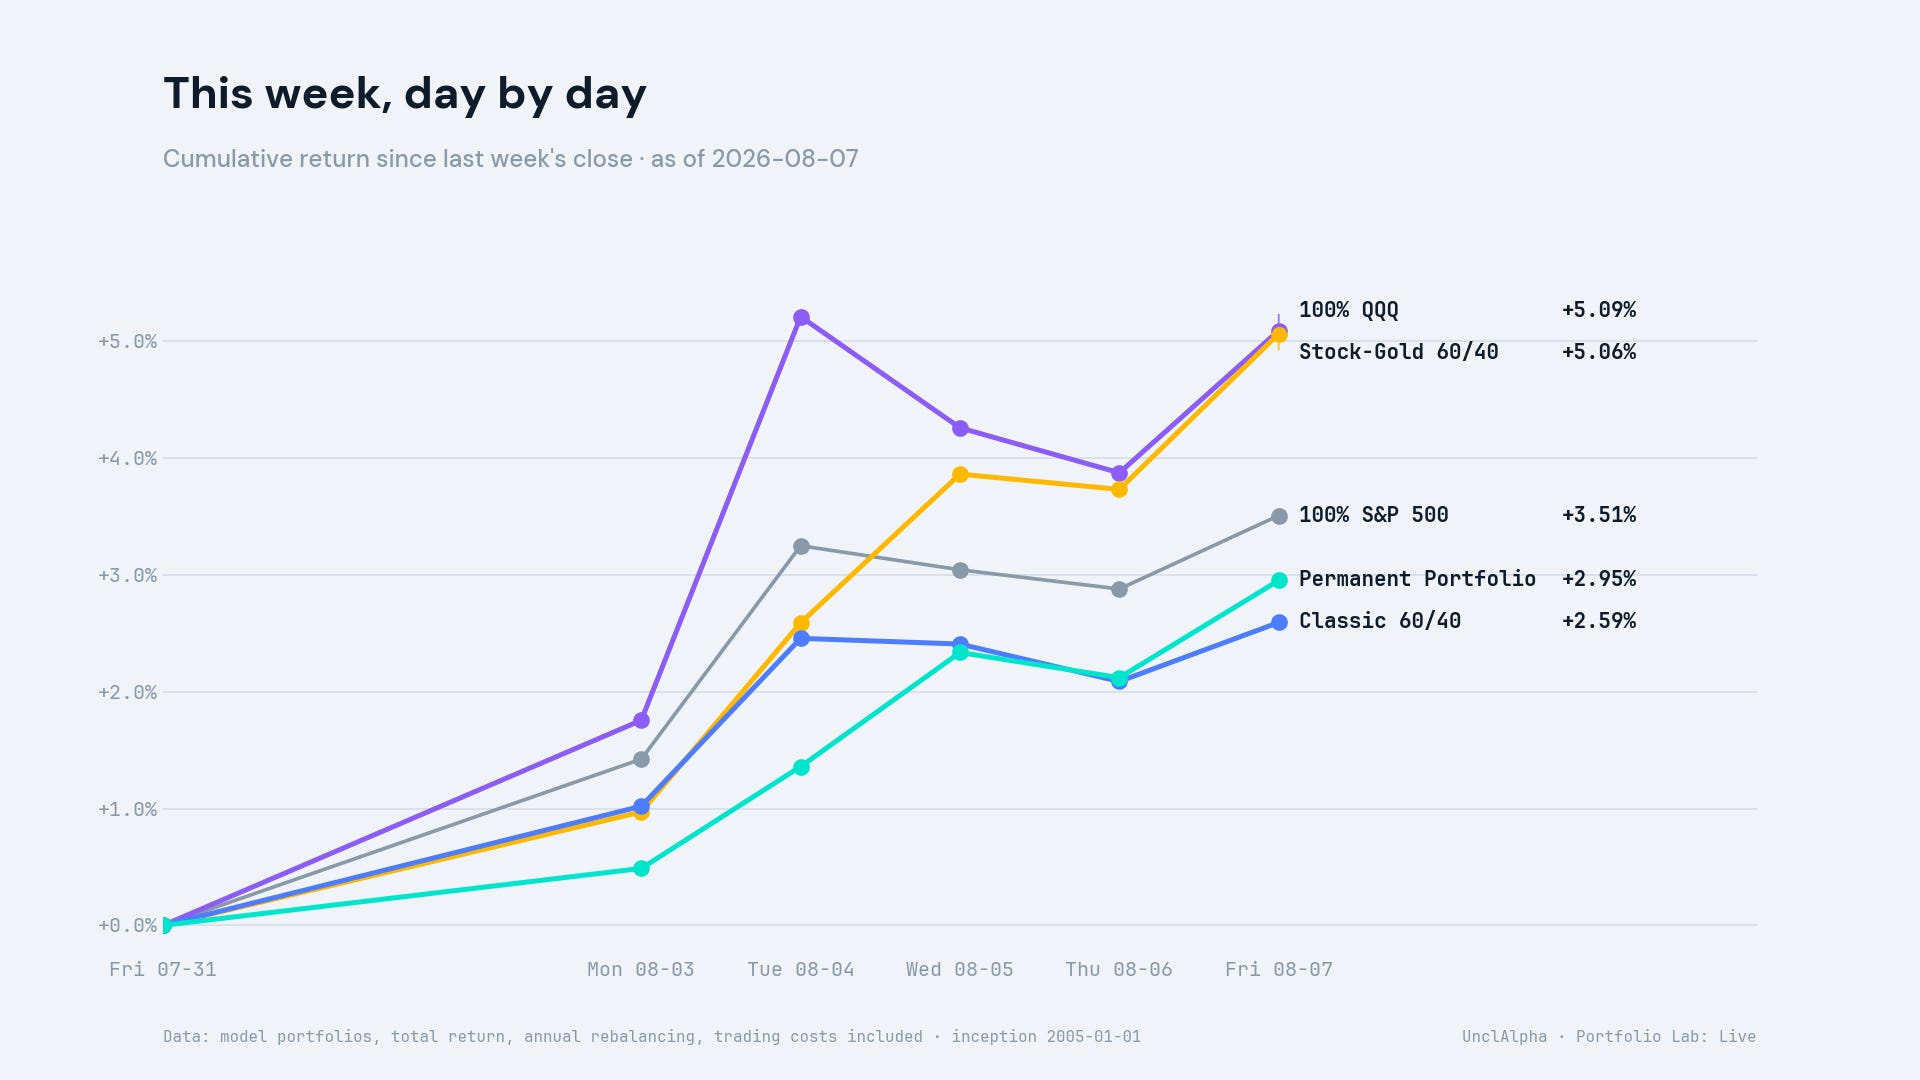
QQQ reached +5.21% for the week on Tuesday, slipped to +4.26% on Wednesday and +3.87% on Thursday, then finished at +5.09% on Friday. The Permanent Portfolio moved from +2.34% on Wednesday to +2.12% on Thursday and +2.95% on Friday. The path shows why Wednesday’s switching impulse could intensify on Thursday even though Friday eventually left both models positive.
The daily table provides the audit beneath that story. It lets a reader compare every model on the same close and verify whether the apparent buffer belonged to one portfolio, several mixed-asset lines, or the whole five-line set.
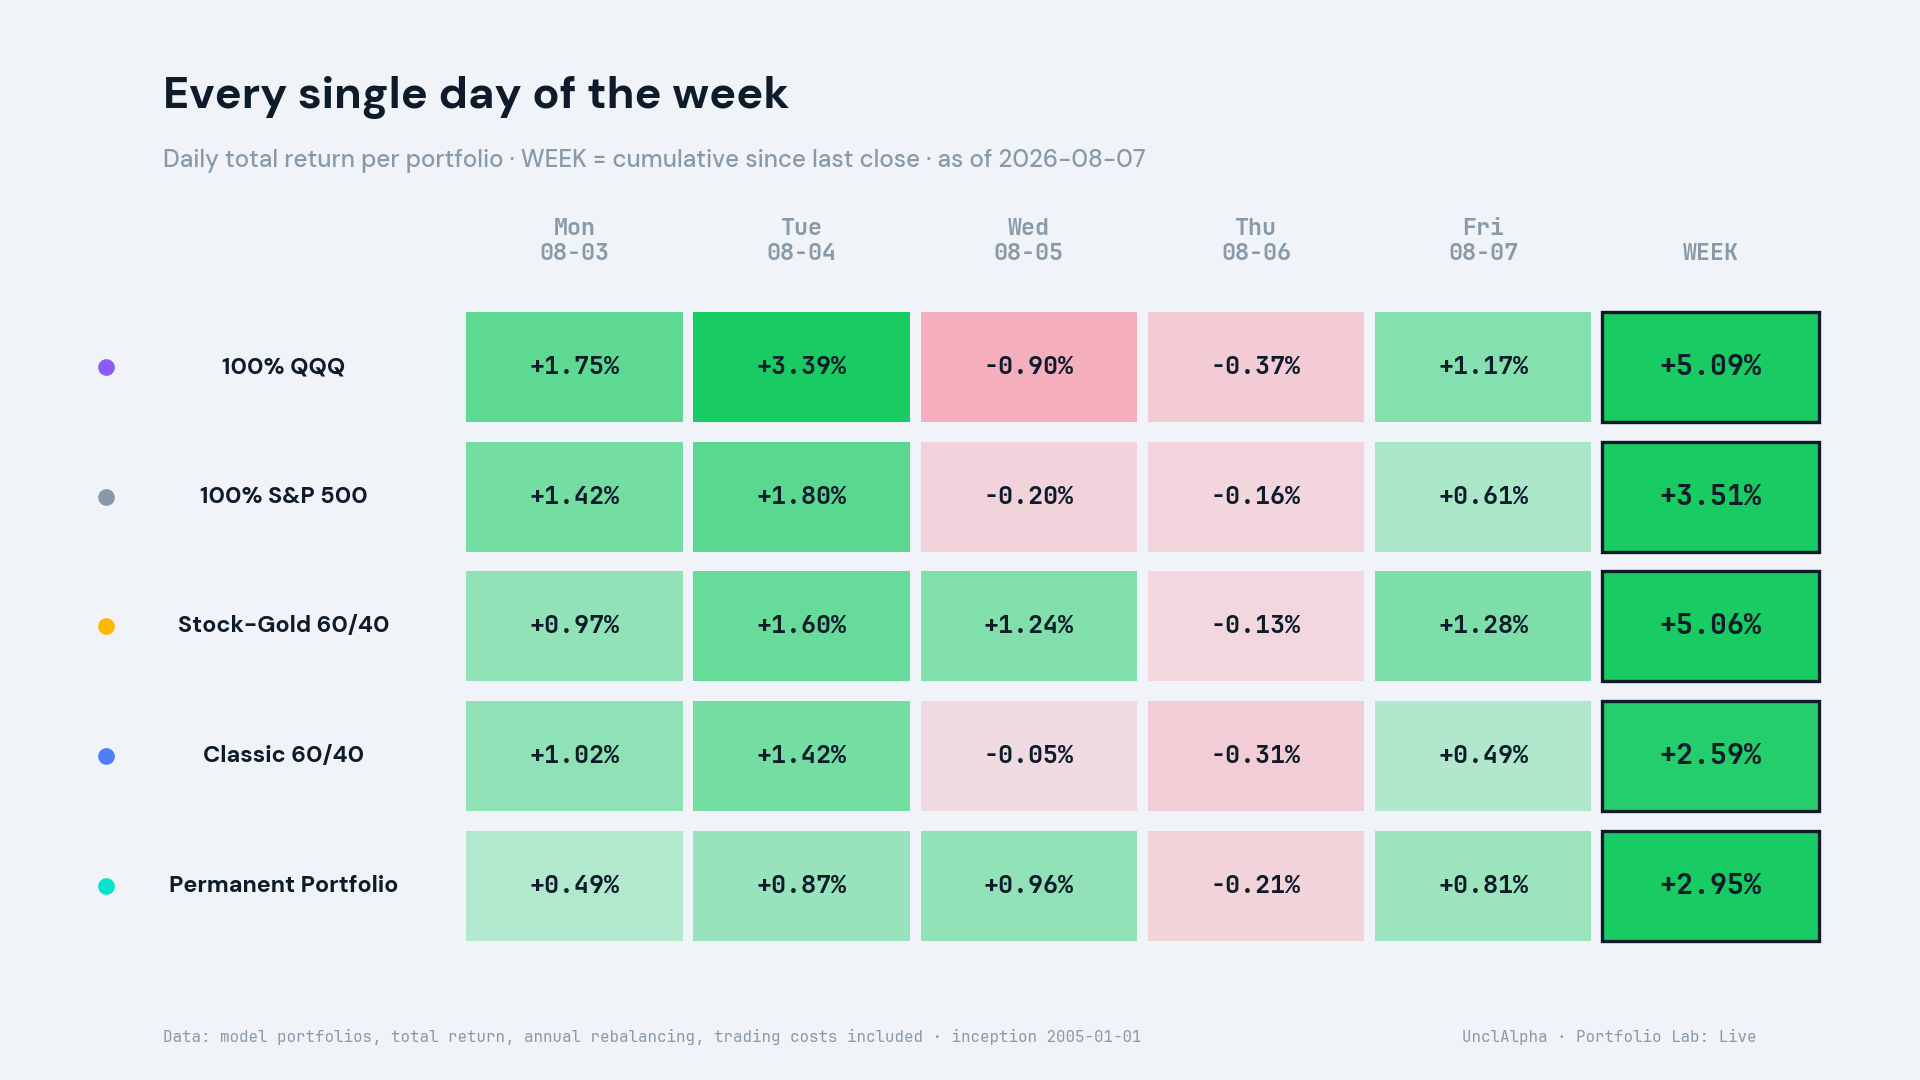
Wednesday split the set: QQQ (−0.90%), the S&P 500 (−0.20%), and Classic 60/40 (−0.05%) declined, while Stock-Gold 60/40 (+1.24%) and the Permanent Portfolio (+0.96%) advanced. On Thursday all five declined; on Friday all five advanced. The buffer was therefore real but temporary—not a permanent property revealed by one close.
Audit receipt
Public weekly receipt SHA-256: f68e401cff1b8e4129b68ee748fa3e9f27d63d61b5dbda7c27a0f790ef3042e7. The hash identifies the exact weekly snapshot used here while the private receipt remains private.
The week ahead: what to watch
Three official observation points fall inside the accepted window.
The July Consumer Price Index is scheduled for August 12 at 8:30 AM ET.
The Advance Monthly Sales for Retail and Food Services report for July is scheduled for August 14 at 8:30 AM ET.
The New Residential Construction report for July is scheduled for August 18 at 8:30 AM ET.
Portfolio Lab will record the fixed paths after the releases exist. Their contents and any market responses were unknown at the research cutoff.
Method and limits
Data cutoff: 2026-08-07. Each historical model starts with a hypothetical $10,000 on 2005-01-01, with the first common observation on 2005-01-03. The tracker uses daily adjusted closes with distributions reinvested. Single-asset lines are buy and hold; multi-asset lines rebalance annually under the registered 0.1% drift threshold. The window excludes QQQ’s 2000–02 crash and includes both a strong gold cycle and a severe bond bear market. Results using GLD are not directly comparable with work using spot gold or gold futures without an explicit bridge.
Portfolio Lab is educational model tracking with no actual holdings. It is not personalized investment advice, a trade instruction, or a promise of return, safety, or repeatability. The holder scenes are path-supported hypothetical scenarios, not evidence of what real people thought or did. Past performance does not guarantee future results. Full disclaimer: https://unclalpha.com/disclaimer
Closing answer
Wednesday did not prove that the QQQ holder had chosen the wrong portfolio. It exposed the cost of living with a concentrated rule at the exact moment a diversified rule looked comforting. The practical question to carry forward is not “Which portfolio won today?” but “Did my evidence about the rule change, or am I reacting to the latest path?” A fixed weekly record is useful because it preserves that distinction before hindsight makes every decision look easier.