

Imagine the worst market timing in history. You put $1 million into the Nasdaq 100 — right before the biggest tech crash ever recorded. All of it. And then you just… hold on.
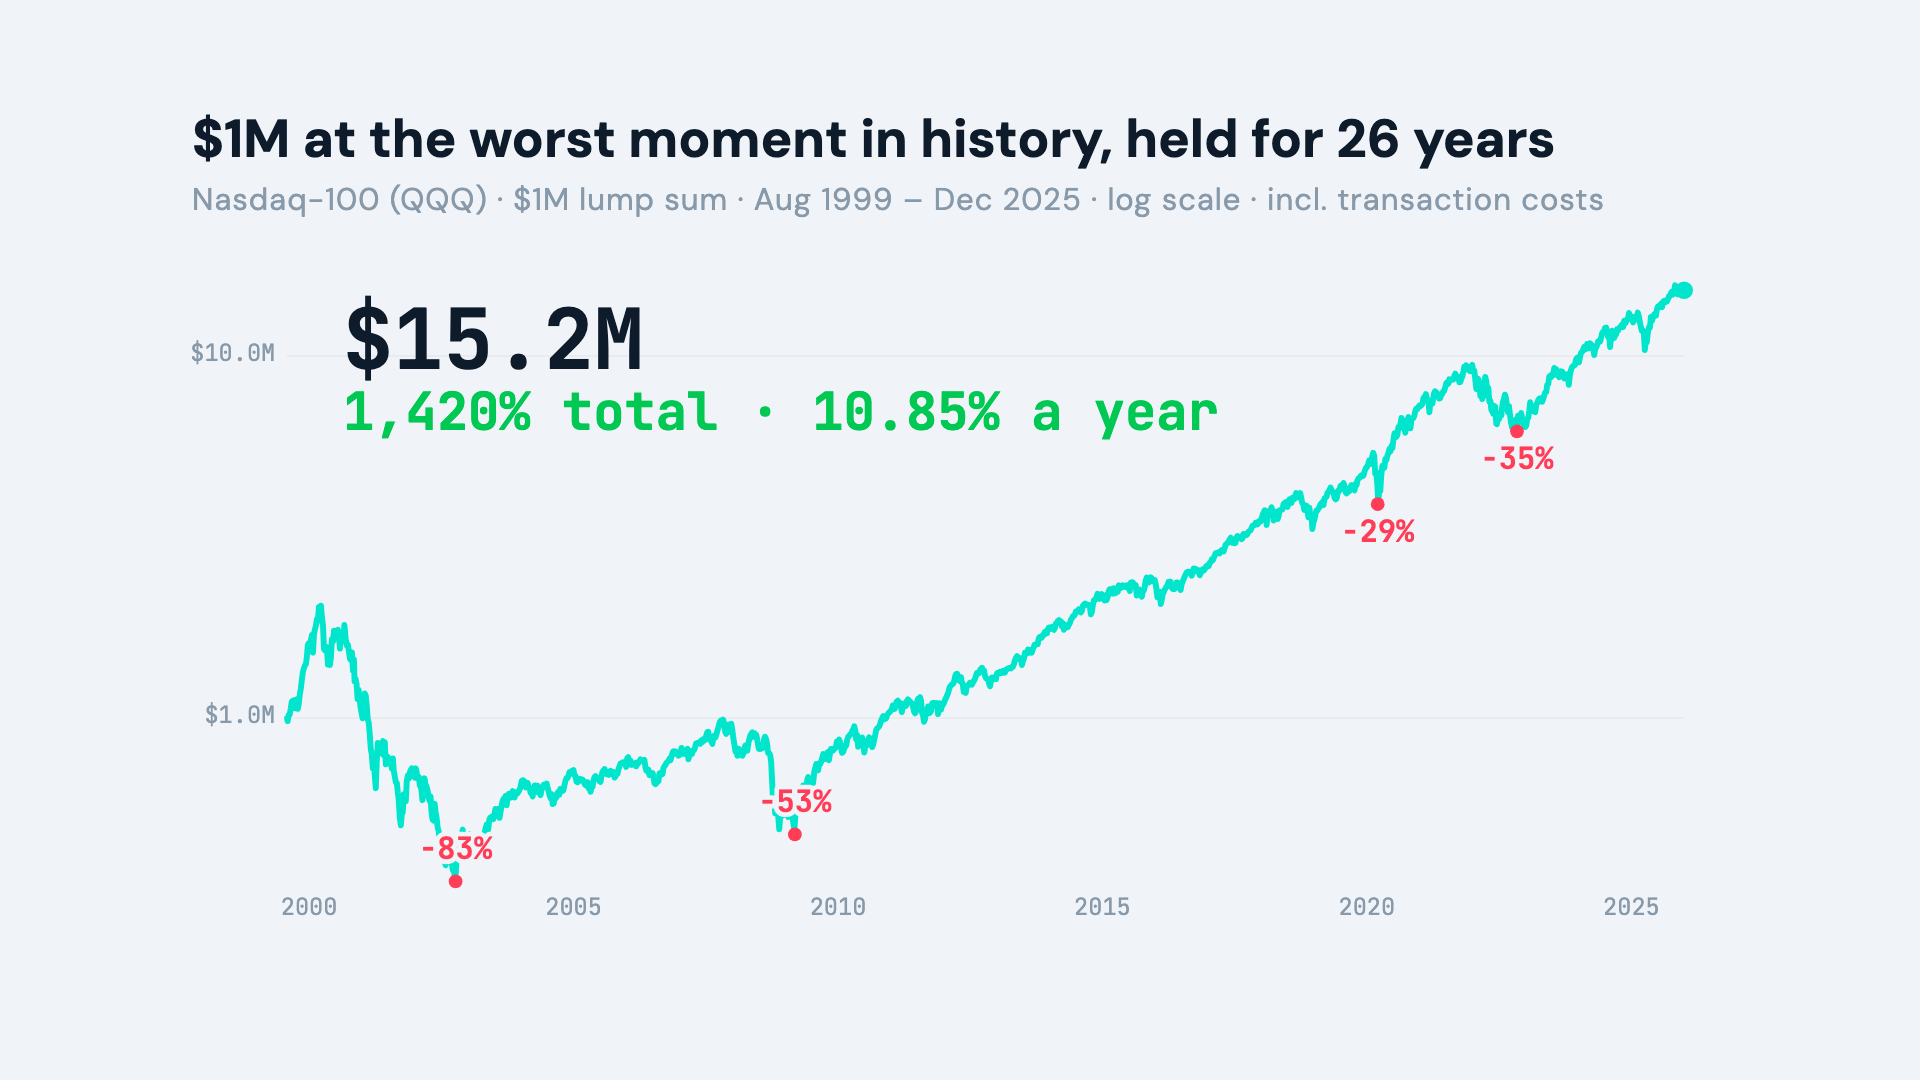
You live through the dot-com bust: your account down 83%. Then 2008 takes another 53%. Then COVID. Then the 2022 rate shock.
Twenty-six years later, that million is worth about $15.2 million.
That’s a 1,420% total return — 10.85% a year, compounded through every disaster the market could produce. And here’s the part that should bother you if you’ve ever paid a fund manager: this “dumb” index — a mechanical set of rules with zero human judgment — beat over 90% of actively managed tech funds over the same period.
I backtested all 6,646 trading days (August 1999 – December 2025), including real transaction costs — commissions, slippage, market impact. Nothing hypothetical.
I’m Uncle Alpha, and this is Alpha’s Backtest Lab. Quant-trained, simply explained. By the end, you’ll know the five mechanical rules that make the Nasdaq 100 work — and the three risks they can’t fix.
Quick note: this is educational, not financial advice. Past results don’t predict the future, and every figure here is nominal — before inflation.
▶️ Prefer to watch? Full video breakdown:
The index is a five-round job interview
Most people think the Nasdaq 100 is just “the 100 biggest tech companies on Nasdaq.” That’s half right — and the missing half is where the edge lives.
Every company has to keep passing five hard filters: listed on the Nasdaq exchange (no over-the-counter stocks); no financial companies; at least 200,000 shares traded per day, so there’s real liquidity; a minimum trading history after IPO; and a top-100 market cap, with a buffer zone down to 120 before you’re kicked out.
That second filter — no banks, no insurers, no investment firms — sounds like a footnote. In 2008, it saved investors’ necks. The S&P 500 carried roughly 20% of its weight in financial stocks. Lehman Brothers went to zero; AIG crashed 99%. The Nasdaq 100 held none of them. Both indexes dropped about the same that year — around 53% — but the reason matters. The S&P fell because its financial core imploded from within. The Nasdaq fell in sympathy, dragged down by the credit freeze — not by holding toxic assets. When the recovery came, that distinction meant everything.
Sometimes what you don’t own matters more than what you do.
A Darwinian machine
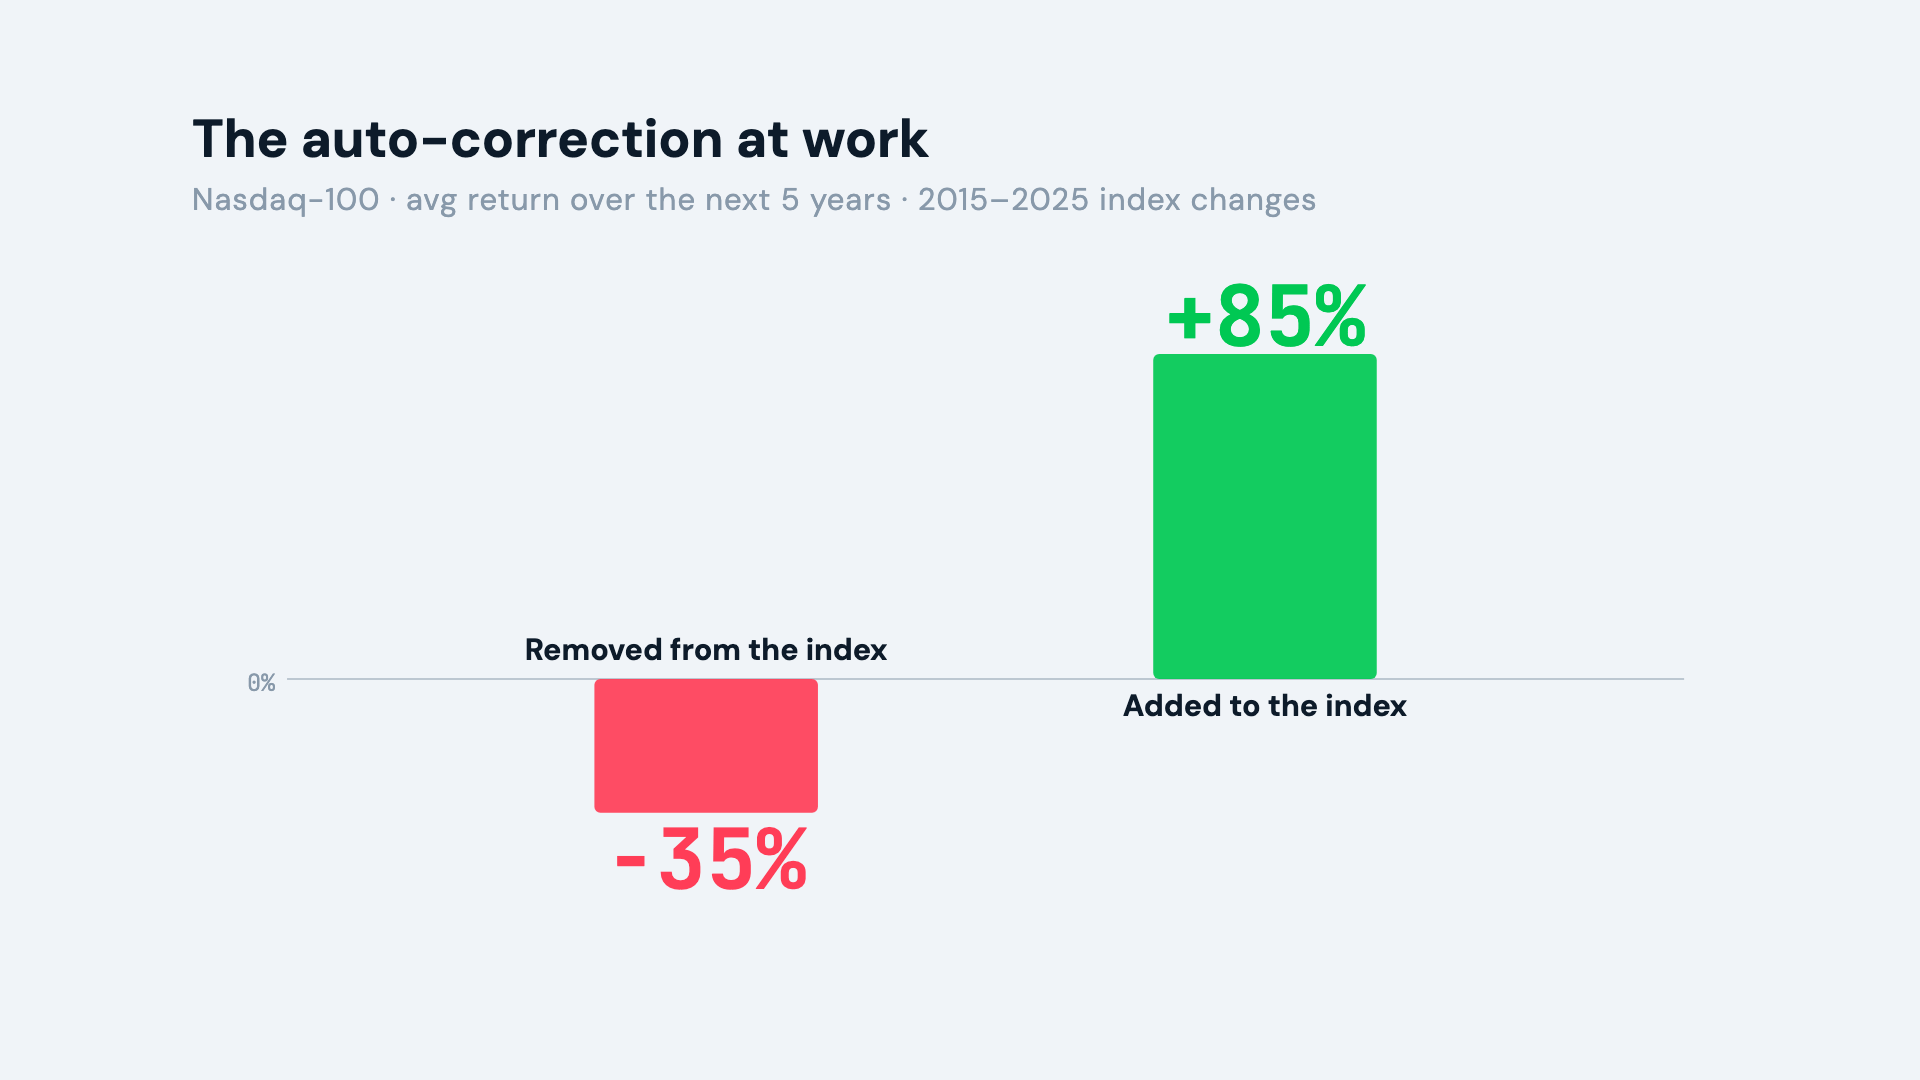
The real genius is the auto-correction. Companies that fall behind get dropped. Companies that surge ahead get added. Between 2015 and 2025, the stocks removed from the index averaged a –35% return over the following five years. The ones added? +85% on average.
The index doesn’t care about narratives. It doesn’t feel loyalty. It just keeps the strongest 100.
Rebalancing: insurance that pays for itself
Then there’s the mechanism most investors misunderstand — rebalancing. The Nasdaq 100 has three layers of it: quarterly check-ups, a thorough annual review each December, and an emergency trigger that fires when concentration gets dangerous — if any single stock exceeds 24% of the index, or the top five together exceed 48%, the index forces a rebalance and trims the biggest positions.
In July 2023, concentration got so extreme that the trigger actually fired — a Special Rebalance, only the third in the index’s entire history. Nvidia’s weight was slashed from over 7% to 4% overnight, and the quarterly rebalances kept adjusting the mega-caps back down afterward.
Was that annoying in the short term? Absolutely. With Nvidia surging after each trim, those caps left an estimated 2–2.5% of returns on the table over two years.
But rebalancing is insurance. You feel like you’re wasting money during good times — then a crisis hits, and it saves your portfolio. During the dot-com era, without the caps, Cisco alone could have reached 12–15% of the index; when it fell 90%, that concentration would have been devastating. The caps shaved an estimated 7–10 percentage points off the losses. Over the full 26 years, this “insurance” contributed roughly 1–2% a year in extra returns.
The premium was worth it.
Three crashes, three different stories
2000 — the deep one. The dot-com crash cut the Nasdaq 100 by 83%, peak to trough. A million dollars invested right before the crash shrank to about $170,000 by October 2002. Most people would have sold in panic long before the bottom.
2008 — the shared one. Both major indexes fell about 53%. But the Nasdaq recovered faster — it wasn’t weighed down by zombie banks still working through toxic assets for years after the crisis.
2020 — the fast one. COVID knocked the index down 29% in just 26 days — and it fully recovered in 79. Why so fast? By 2020, the index’s natural selection had already loaded it with pandemic winners: Zoom, Amazon, Microsoft, Netflix, Nvidia. The machine had positioned itself before the crisis hit.
Lump sum vs. dollar-cost averaging: a 35-point gap
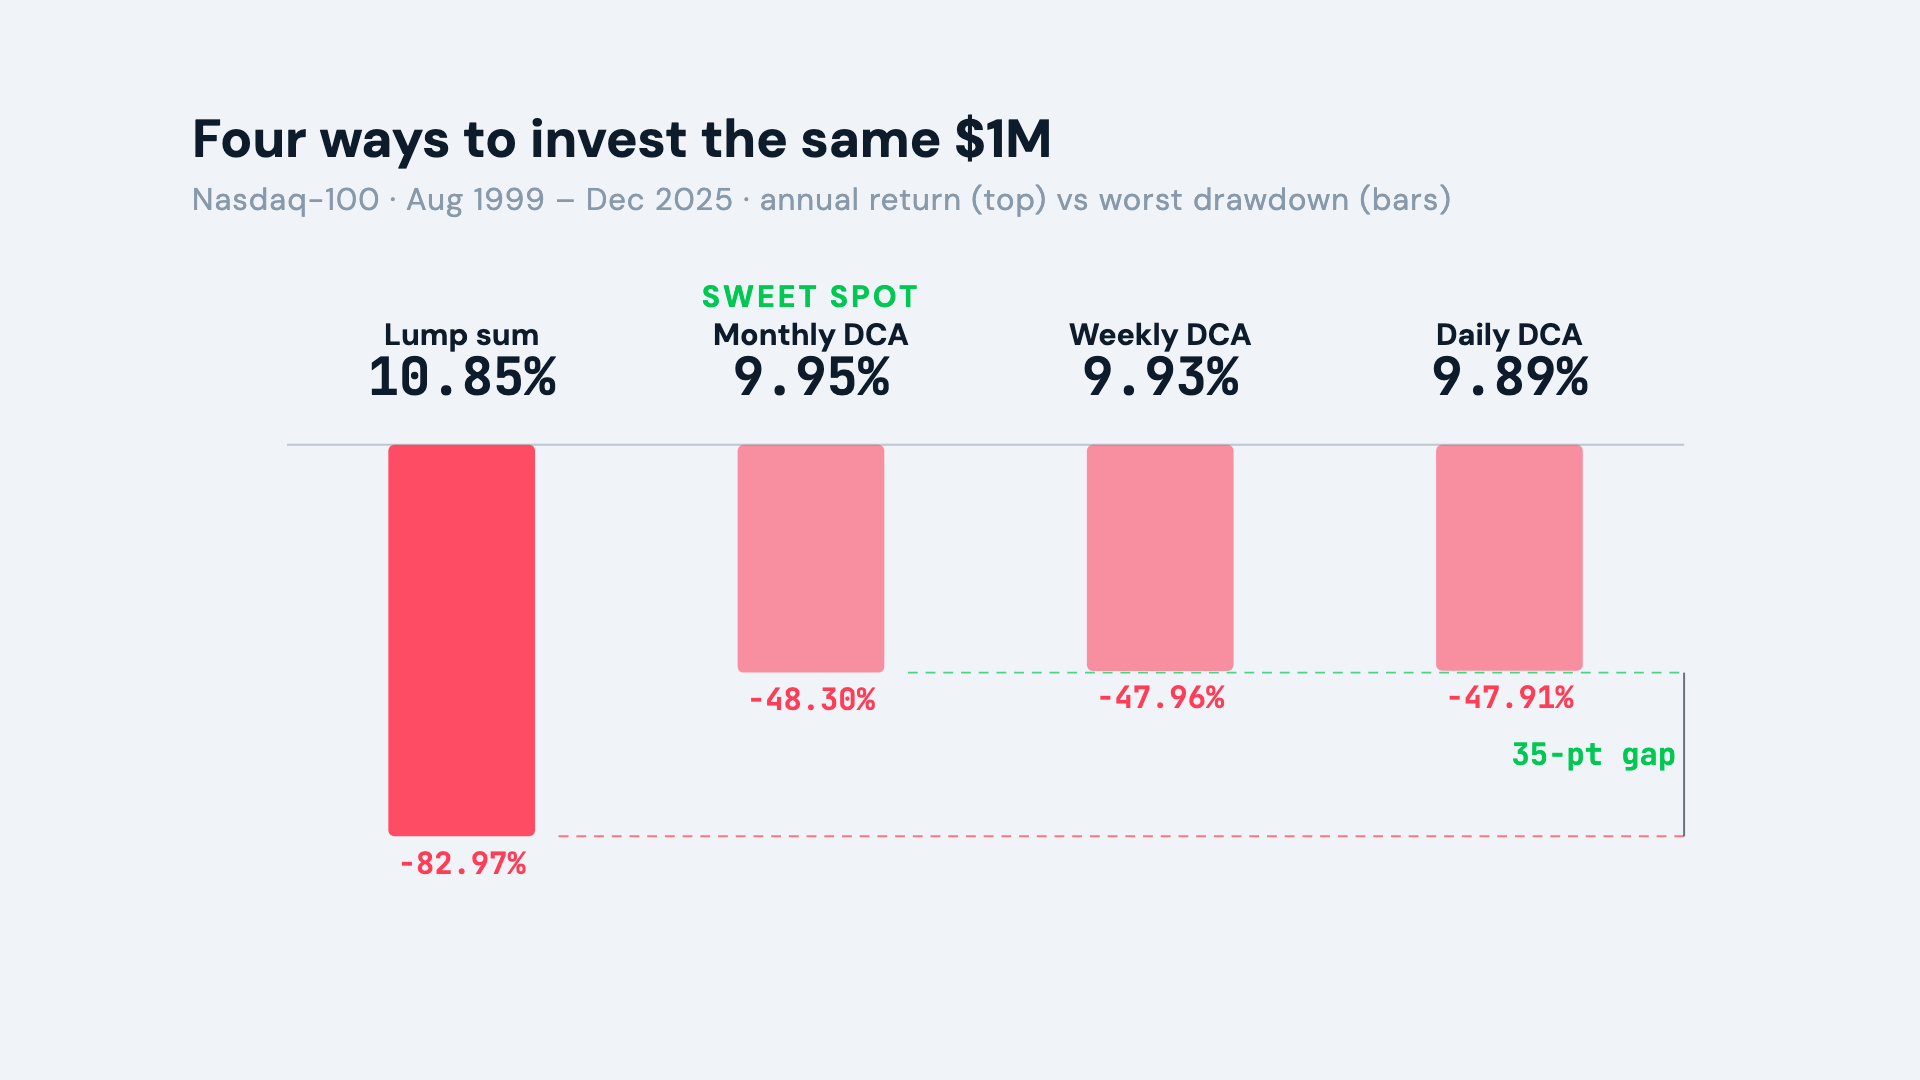
Now the practical part. I tested four ways of putting the same $1 million into the Nasdaq 100 over the same period: all at once, or spread out daily, weekly, or monthly.
Lump sum wins on raw returns — by a wide margin. That’s basic compounding math: a dollar invested on day one compounds for 26 full years; a dollar invested halfway through only gets 13.
But look at the worst-case drawdown. Lump sum: –83%. Monthly DCA: –48%. A 35-percentage-point gap.
That gap matters more than the return gap, because it decides whether you’re still in the game. The lump-sum investor put in a full million at the peak and stared at $170,000 by 2002 — $830,000 gone on paper. The DCA investor had only deployed a fraction of their capital at peak prices — and was buying more shares every month at up to 80% off. Same crash, completely different psychological position. When the recovery came, those cheap shares became the foundation of all the future gains.
And the difference between daily, weekly, and monthly? The annual returns are virtually identical — the gap is less than a tenth of a percent — and the drawdowns are nearly the same. In the data, monthly is the sweet spot: simplest to execute, minimal mental overhead, essentially the same result.
The fee trap: how 2.3% a year eats $6 million
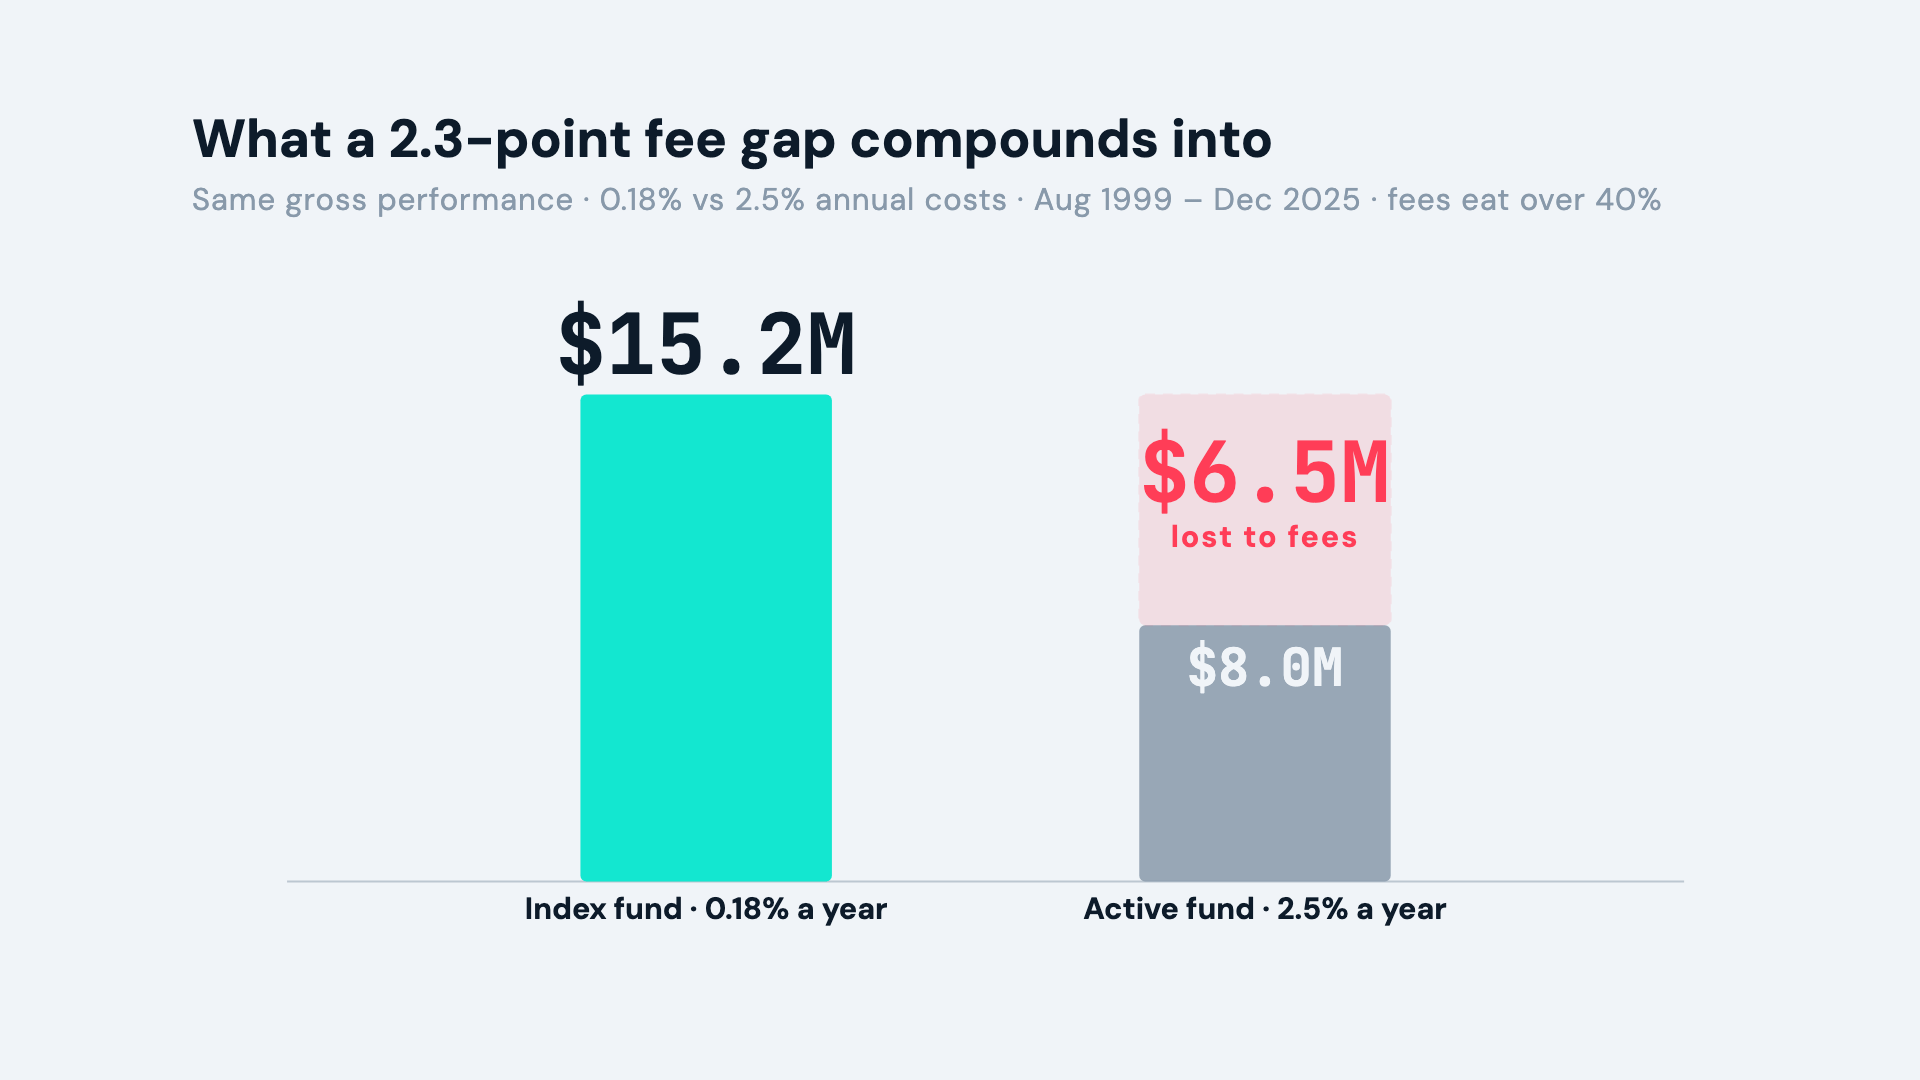
A typical active tech fund costs about 2.3 percentage points more per year than an index ETF. Not just management fees — constant trading (turnover around 150% a year) racking up transaction costs, performance fees, sometimes sales loads. QQQ charges 0.18% — and it got even cheaper in December 2025, when it converted from a unit trust to an open-end ETF.
Every year, 2.3% looks tiny. Compound it over 26 years and it swallows more than $6 million — over 40% of your potential ending wealth, gone to fees.
And that assumes the active fund matches the index’s raw performance before fees — which 92% of them can’t even do.
Five reasons the pros keep losing
Fees eat the edge. Even a manager who picks slightly better stocks loses that edge to 2.3% a year in costs.
They time the market badly. During the 2020 COVID crash, 60% of active funds reduced their positions — and missed the fastest V-shaped recovery in history. The majority of professionals panicked at precisely the worst moment, selling near the bottom of a crash that healed within three months.
They miss the big winners. Amazon at a 500× PE was “too expensive” in 2015. Tesla was “fundamentally broken” in 2019. Nvidia at 100× was “a bubble” in 2023. The index doesn’t look at PE ratios — if the market cap qualifies, the stock goes in. It automatically owns every mega-winner.
Size kills flexibility. A fifty-billion-dollar fund can only buy large caps — it becomes an expensive index fund with higher fees.
Survivorship bias hides the failures. Over the past 25 years, 60% of actively managed tech funds shut down or merged. The “star funds” you hear about are the survivors. It’s like judging restaurants by only looking at the ones still open — the hundreds that quietly closed took their track records with them.
Three things the index can’t fix
Concentration. About 65% of the index is technology. In 2022, when tech corrected, the Nasdaq 100 fell about 35% while the S&P 500 fell 24%. If it’s your only holding, you’re making a massive sector bet.
Volatility. Annual volatility runs about 27%. That means roughly once every five to six years, you could see a full-year loss of 14% or more — and the drops within a year can be much worse. It’s a wild ride.
The 83% problem. Even with the filters and the rebalancing caps, the deep crash still happened. In this backtest, the account that started at the 2000 peak didn’t reach a new high until September 2014 — more than fourteen years underwater. The rules soften crashes; they don’t eliminate them. If the Nasdaq 100 is your only asset, there’s nowhere to hide in a deep bear market.
Steal these three rules
Read the rules, not the story. Before you trust any index or fund, find out what gets a stock in — and, more importantly, what kicks it out. The discipline lives in the exit rule.
Pick your entry style by the drawdown you can survive, not the return you hope for.In this backtest, monthly buying gave up some return versus a lump sum but cut the worst-case drawdown from 83% to 48% — and daily or weekly added nothing over monthly.
Compound the costs before you compound the returns. A 2.3-point annual fee gap reads like a rounding error. Over 26 years, it was 40% of the ending wealth.
One honest caveat: this is one index, over one stretch of history, heavily weighted to U.S. technology, measured in nominal dollars. The last 26 years can’t promise the next 26.
Bottom line
The Nasdaq 100 isn’t magic. It’s five mechanical rules working together: a selection filter that keeps the strongest companies. An auto-correction that swaps losers for winners. Rebalancing caps that control concentration risk. Fees so low they’re almost invisible. And rules-based discipline that takes human emotion completely out of the equation.
Over 26 years, those rules turned $1 million into $15.2 million — beating 90% of the professionals who tried to outsmart them.
But no single asset, no matter how good, is a complete portfolio. An 83% drawdown is the price of that 10.85% a year — and understanding both sides is the first step toward building something that actually matches your risk tolerance.
Don’t try to outsmart the market. Out-discipline it.
Next: I take that 83% problem head-on — a three-asset portfolio (broad market, Nasdaq 100, and gold) that cut the maximum drawdown to 34% while actually delivering a higher annual return. Subscribe and I’ll see you there.
— Uncle Alpha · Quant-trained, simply explained.
▶️ Watch the full breakdown on YouTube:
*For educational purposes only. Not financial advice, and not a recommendation to buy or sell any security. Past performance does not guarantee future results. Full disclaimer: unclalpha.com/disclaimer