

Put $5,000 into the S&P 500 every single January, for eighteen years — no matter what the market does. How much do you end with?
I could give you one number. It would be a lie. So I ran that exact plan through every eighteen-year stretch the S&P 500 has offered since 1993 — all sixteen of them. Sixteen parallel lives: same money, same discipline, differing only in when they begin. The same $91,000 went in every time. The endings differed by more than double.
One of those lives ends in a way nobody likes to show you.
And before any results, here’s the one thing all sixteen share: every life — even the luckiest — at some point watched nearly half its money disappear. Nobody skipped that part.
I’m Uncle Alpha. Quant-trained, simply explained. By the end of this piece, you won’t need my answer to “is it worth it?” — you’ll have your own.
Quick note: this is educational, not financial advice. Everything here is a backtest of SPY, the S&P 500 ETF, from January 1993 through December 2025 — $1,000 to open, $5,000 every January, trading costs included, all figures nominal (before inflation).
▶️ Prefer to watch? Full video breakdown:
The plan, in one breath
One thousand dollars to open. Five thousand every January, into the S&P 500, for eighteen years. Never skip, never sell. That’s dollar-cost averaging — the most repeated advice in investing.
Why eighteen years? It’s the length of a childhood. And starting in 2026, it’s the exact window the new Trump Accounts hand every eligible American newborn: $1,000 that rides the market until age 18. Nobody picks which eighteen years they get.
Hold that sentence. It’s the whole story.
Life One — the cursed start (January 2000)
Life number one opens its account in January 2000 — the top of the dot-com bubble. The worst starting point in modern market history. Within three years, the market loses half its value. It crawls back — then 2008 cuts it in half again. Two of history’s great crashes, inside one window.
If timing decides everything, this life is doomed. Here’s what actually happened.
Eighteen deposits. $91,000 in. And at the end: $225,056 — 2.47× the money. Not doomed. Not even dented.
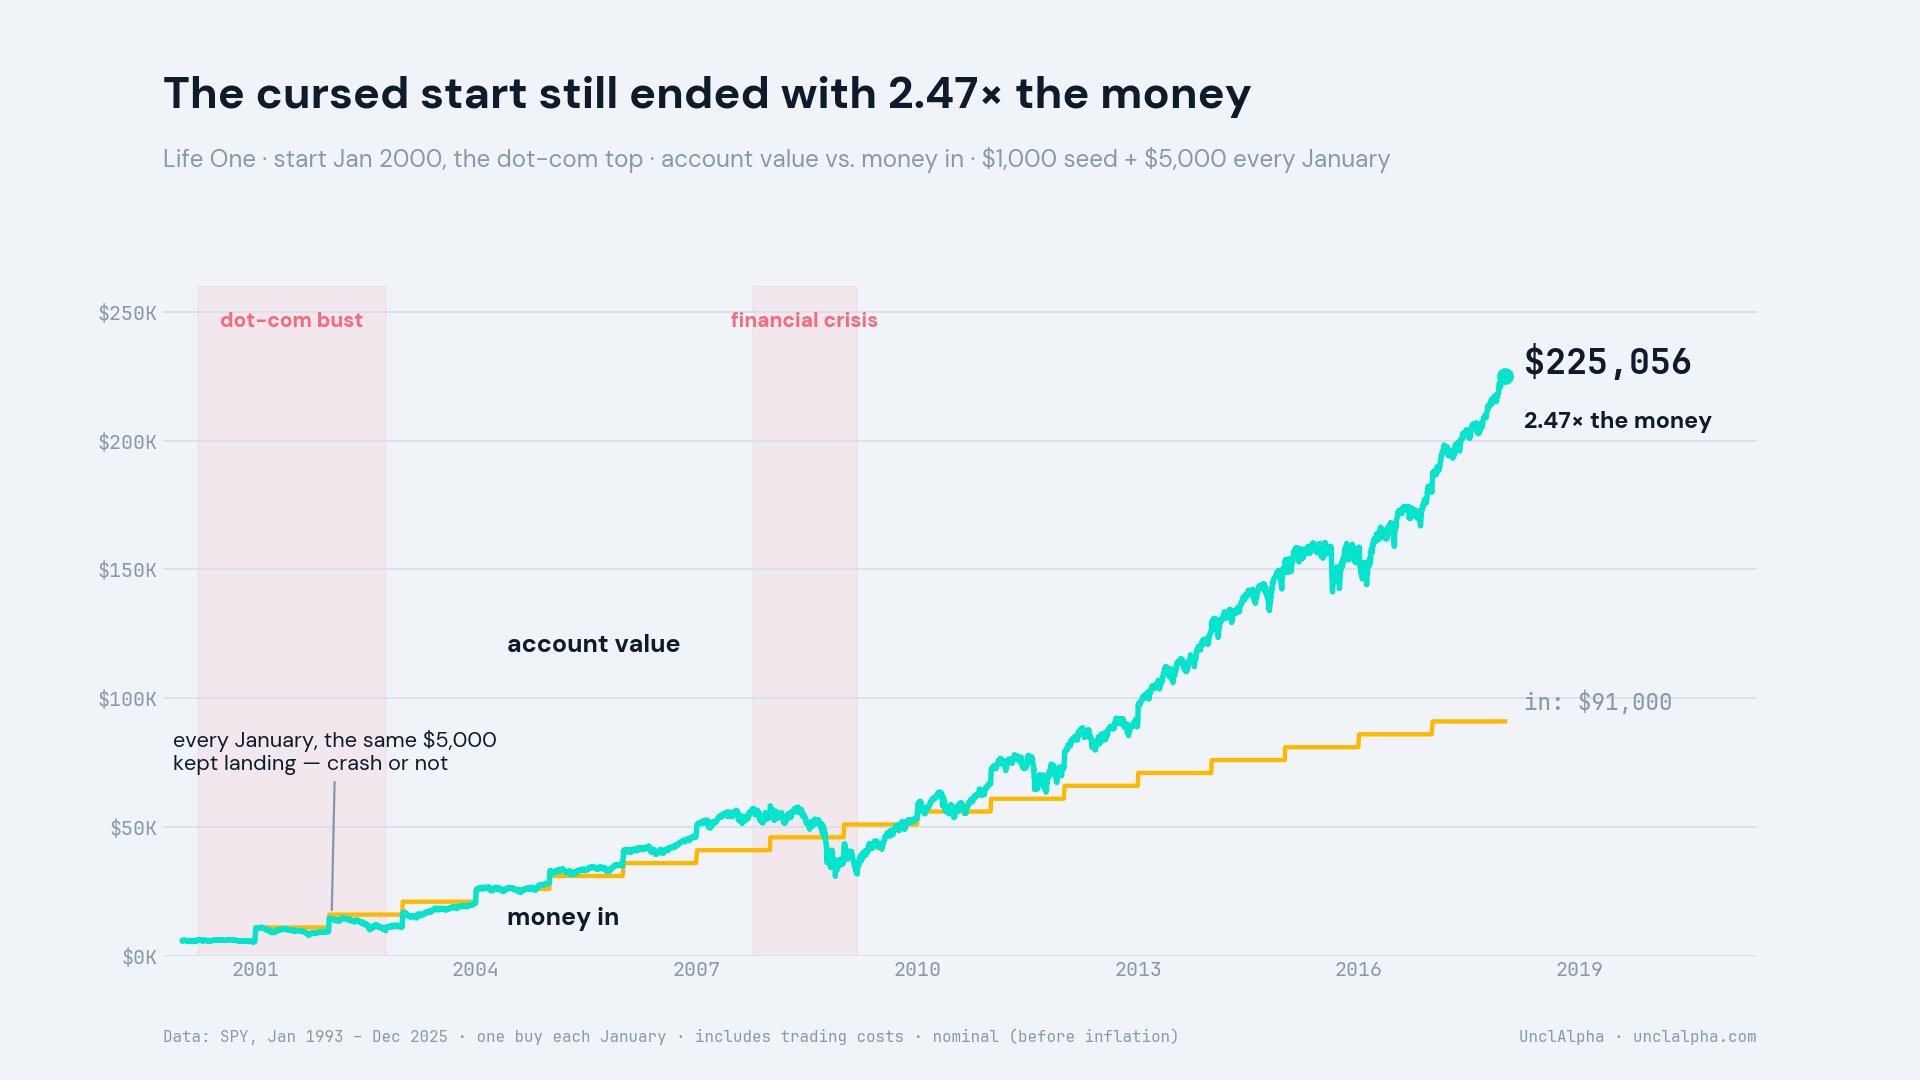
Now it gets strange. Compare this life to the laziest alternative there is: drop the whole $91,000 in on day one, then never touch it. That lump sum grew at 5.4% a year. This life’s dollars earned 8.8%.
(Yardstick note: the market’s figure is a CAGR — time-weighted. The plan’s is an XIRR — money-weighted, the honest yardstick when cash arrives in installments.)
How? Every crash January, the same $5,000 bought more shares. The market kept going on sale — and this investor kept showing up.
A crash, to someone still buying, is a discount.
So the worst timing in modern history didn’t hurt the plan — it powered it. Which means the plan is unbeatable... right?
Remember the life I said nobody likes to show you? Here’s the twist: the market it lived through was better than this one — 8.0% a year, against 5.4%. Better market. Worse ending. How is that possible?
Life Two — the golden start that lost (January 1993)
Life number two starts seven years earlier, in January 1993 — and draws the dream opening. The roaring nineties. Eight straight winning years. By the time the dot-com bubble bursts, this account has been compounding for nearly a decade.
And that — exactly that — is the problem.
Deposit vs. pile
Watch what happens to a $5,000 deposit over time. In year one, it’s most of the account. By year fifteen, it’s pocket change next to a $150,000 pile. Early crashes hit a small pile that’s still mostly future paychecks. Late crashes hit the whole pile, at its biggest.
In this life, the storm waits. The dot-com bust stings — the account recovers. Then 2008 arrives, in year sixteen. Half the pile — 51.6% — gone. Then almost four years underwater. And the window just... runs out. Eighteen years end before the damage fully heals.
Final count: $91,000 in. $163,697 out — 1.80×.
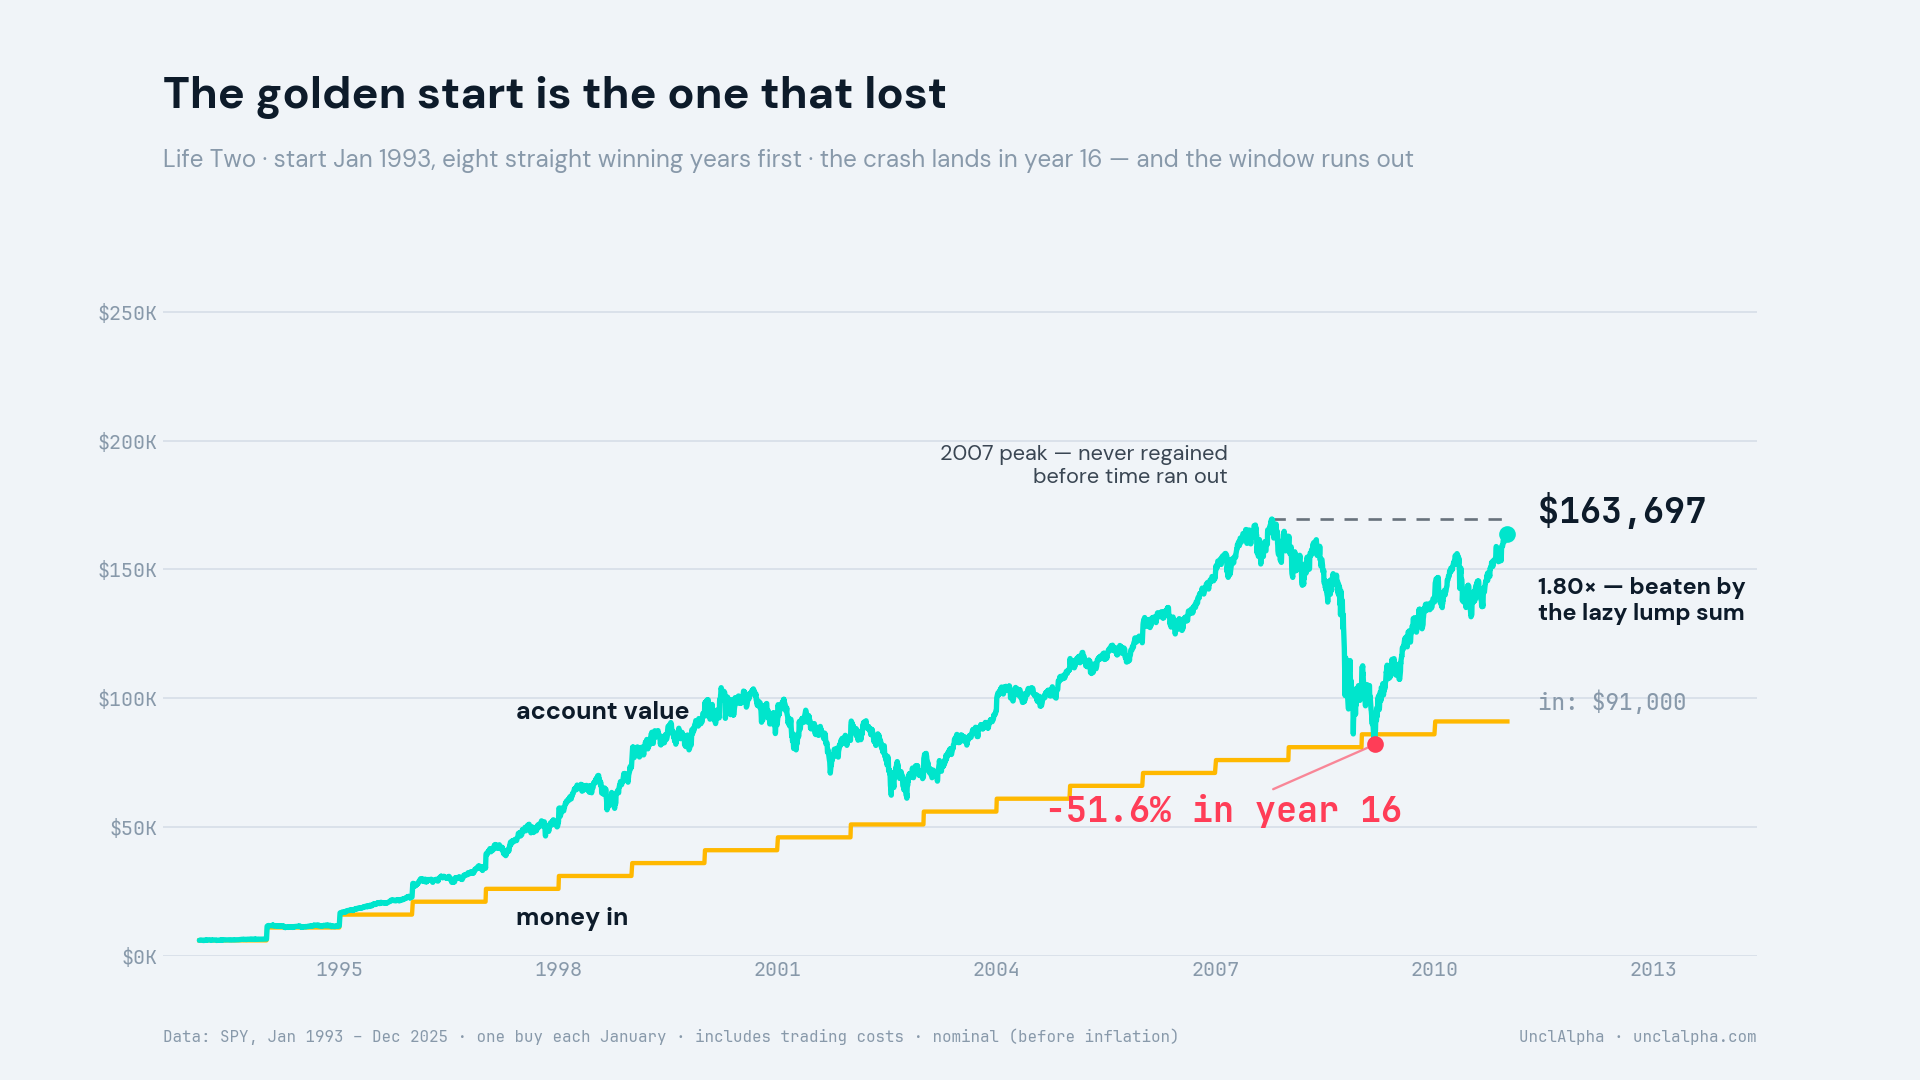
Still a profit — but here’s the part that never makes it into the ads: the lazy lump sum beat this life, by about 2 percentage points a year, compounded. Same discipline as Life One. A better market than Life One. And this is the life that lost.
So the answer was never the average. It’s the order. The same crash that’s a discount in year three is a trap in year sixteen. Finance has a name for this — sequence-of-returns risk: when your returns arrive matters more than what they average.
Which leaves one question. If a crash at the end can sink a golden start... what happens to a life that begins inside the crash? Call it before you scroll.
Life Three — born in the fire (January 2008)
Life number three opens its account in January 2008. Within about a year, nearly half of everything it has put in is gone. Picture that investor: two years in, down by almost half, sixteen more Januaries to go.
If the rule holds, this should be a gift. The scariest start is also the cheapest — years of fire-sale buying, straight into the longest bull run in modern memory.
Final count: $91,000 in. $389,288 out — 4.28× the money. The best of all sixteen lives. And even though this window’s market was the strongest of the sixteen, the plan still beat the day-one lump sum — by 2.7 points a year.
The scariest start produced the jackpot. The dreamiest start produced the loser. And this time — you saw it coming.
All sixteen at once
Three lives. I promised you sixteen.
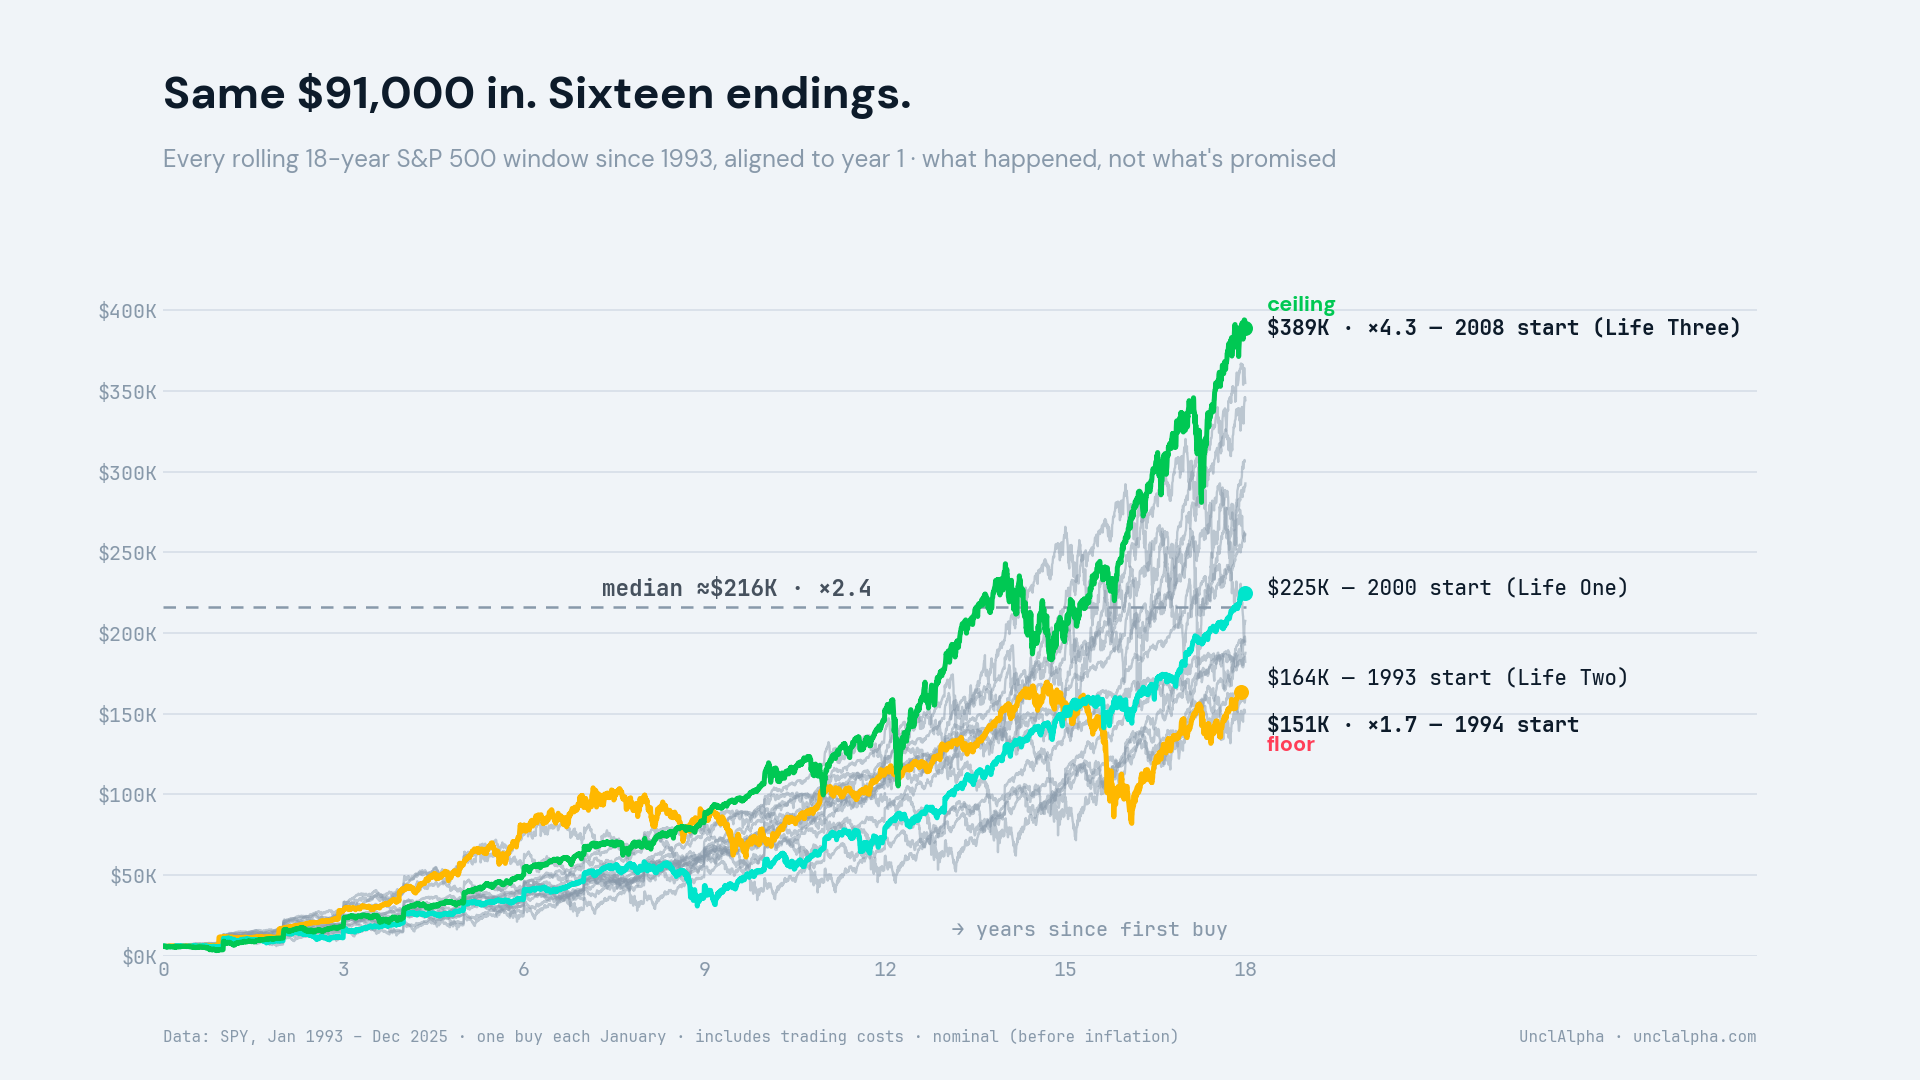
Same $91,000. Sixteen endings. The floor: a 1994 start — $151,336, lower than any life I’ve shown you. The ceiling: $389,288. The middle of the pack: about $216,000 — money multiplied by 2.4. Historically. That word is doing real work: this is what happened, not what’s promised.
Now the census. Against the day-one lump sum, this plan won 11 windows out of 16. And the five it lost? Every one of them started in the golden nineties. Every start from ‘93 to ‘97 — the most comfortable years to begin — lost to the lump sum. Every start from ‘98 on — the bubble top, the crisis, all of them — won.
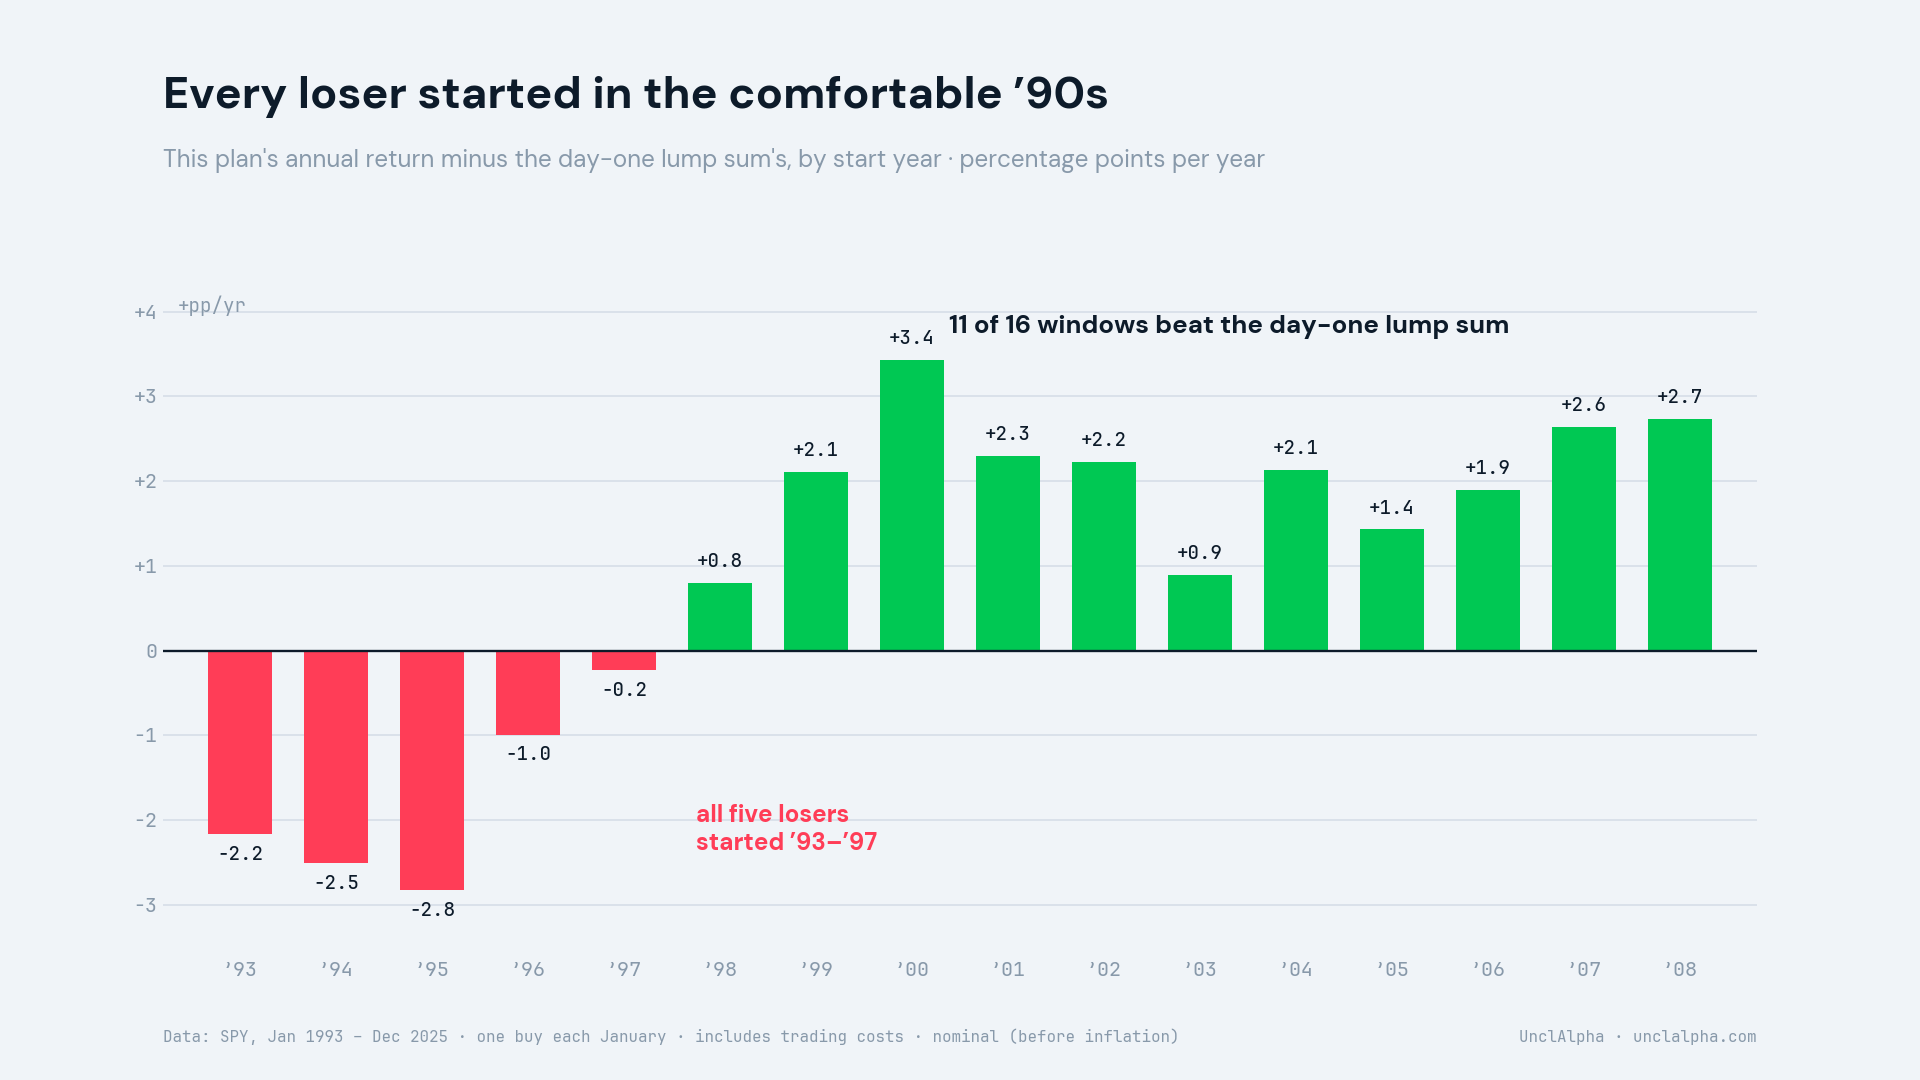
The more comfortable the beginning, the worse this plan did. Because a golden start just means your crash hasn’t happened yet. And when it comes, it comes for the big pile — late.
One honest footnote: these sixteen windows overlap — they share years, so they’re not sixteen independent rolls of the dice. But they are every eighteen-year window the S&P 500 has offered in three decades.
The answer you own
Before you answer the question we started with, look at that fan chart one more time. There’s something every line has in common — and it’s worth more than any number on the screen.
Every ending you’ve seen — the floor, the middle, the jackpot — belonged to an investor who made all eighteen deposits. Through the halving. Through four years underwater. Through a start that felt cursed. Not one of those lines exists without that. The chart doesn’t show sixteen market outcomes. It shows the same behavior meeting sixteen different markets.
You don’t get to pick your eighteen years. You only get to pick whether you keep buying through them.
So — worth it? Here’s the honest frame: across these sixteen windows, eighteen years of discipline bought a range. The worst of them: 1.7× the money. The middle: around 2.4×. The best: 4.3×. Before inflation. And that range is a report card, not a floor. The next eighteen years could land inside it — or below it. This data shows the worst case so far... not the worst case possible. Whether that range is worth it was always yours to answer.
The next time someone says “just invest for the long run,” you own the two questions that actually matter:
What happens if the crash lands late in my window?
Will I keep buying when it does?
Want the same plan stretched over thirty-three years — every January since 1993, through every crash, one unbroken run? That’s the companion piece:
Is the $1,000 Newborn Investing Account Actually a Good Deal? I Ran 33 Years of Numbers.

The U.S. government just created an account that drops $1,000 into an S&P 500 index fund for every eligible newborn. Four million kids are already signed up.
Aim right. Stay long.
— Uncle Alpha · Quant-trained, simply explained.
▶️ Watch the full breakdown on YouTube:
For educational purposes only. Not financial advice, and not a recommendation to buy, sell, or hold any security. Backtest of SPY (S&P 500 ETF), January 1993 – December 2025: $1,000 opening buy plus $5,000 each January, trading costs included, nominal values (before inflation). The sixteen 18-year windows overlap and describe one market history; results are historical and do not guarantee future outcomes. Full disclaimer: unclalpha.com/disclaimer